

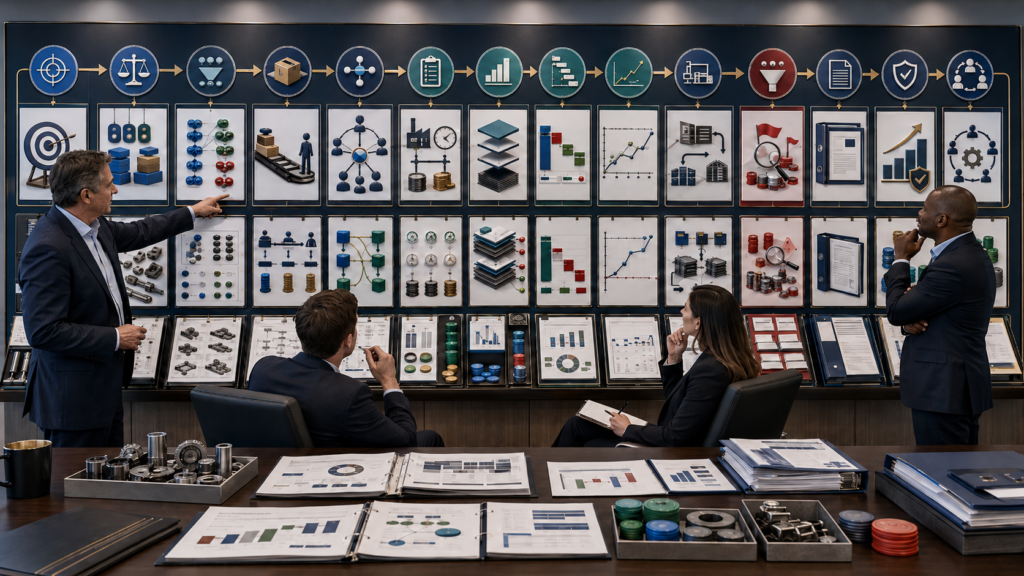
By Vincent Howard, CPA | Managing Partner, Howard, Howard and Hodges | SkillAbility for Accounting Firms
Last updated: August 28, 2026 | 31-minute read
- What cost accounting training should produce
- What is current in cost accounting in 2026
- Where cost-accounting judgment concentrates
- The COST READY framework
- Financial, managerial, and tax cost are different lenses
- Direct/indirect, product/period, fixed/variable
- Build a defensible unit cost
- Overhead pools and allocation drivers
- Normal capacity and abnormal production cost
- Standard costing and variance analysis
- Gross margin: explain the bridge, not just the percentage
- Contribution margin and unit economics
- Break-even and margin of safety
- Price, volume, mix, and efficiency analysis
- Customer/job/location profitability
- Relevant-cost decisions and full-cost traps
- Reconcile the cost model to inventory, COGS, and GL
- Book cost versus section 263A tax capitalization
- Worked unit-economics example
- Self-review checklist
- 100-point readiness scorecard
- 30/60/90-day development plan
- 15 realistic scenarios
- What CPA firms should measure
- Frequently asked questions
What Is Cost Accounting Training for Accountants?
Cost accounting training develops an accountant’s ability to trace economic resources into products, services, customers, jobs, and periods—and then explain how those costs affect inventory, cost of goods sold, gross margin, contribution margin, and business decisions.
The discipline sits between financial accounting and management decision-making. Financial reporting asks, What cost belongs in inventory and COGS under U.S. GAAP? Management asks, Which product, customer, service, or channel actually contributes to profit and capacity? Tax may ask a third question: Which direct and indirect costs must be capitalized under the applicable tax method?
This topic connects directly to Inventory Accounting Training for Staff Accountants, Month-End Close Training for Staff Accountants, Workpaper Review Checklist, Professional Skepticism Training for Junior Accountants, and Scenario-Based Training for Accountants.
Why Cost Accounting Is a Judgment-Development Topic
I have practiced public accounting since 1990, founded my accounting firm in 1993, and helped grow Howard, Howard and Hodges from three people to approximately 50 staff. Since 2020, I have built SkillAbility around a recurring development problem: staff often learn how to calculate a number before they learn what the number means.
Cost accounting makes that weakness visible immediately. A spreadsheet can divide factory overhead by machine hours. It cannot prove machine hours are the right driver. An ERP can calculate standard cost. It cannot prove the standard still resembles current economics. A dashboard can show gross margin fell from 36% to 29%. It cannot explain whether the cause was price, mix, purchase cost, labor efficiency, overhead absorption, inventory write-downs, or a cutoff error.
“The model calculates” is not the capability. “The model has a defined purpose, a supportable cost basis, a defensible driver, and an explanation of the resulting margin” is.
What Is Current in Cost Accounting in 2026?
There is no new sweeping “cost accounting standard” in 2026. The freshness comes from the economics feeding cost systems: changing tariffs, production levels, supply chains, labor costs, automated systems, and management demand for product-level profitability.
| 2026 Development / Current Risk | Training Implication |
|---|---|
| KPMG’s October 2025 Inventory Handbook remains current | ASC 330 principles are stable, but companies still need judgment about which costs are inventoriable and how modern operating models affect inventory costing. |
| June 2026 inventory guidance highlights margin sensitivity | KPMG notes that judgments about which costs are capitalized and how they flow through inventory can materially affect gross margin. |
| Tariffs and supply-chain changes alter landed cost | Staff should separate true purchase-price effects from freight, tariff, mix, and obsolescence impacts when explaining margin. |
| Abnormal production levels affect fixed-overhead absorption | Abnormally low production should not be used to load more fixed overhead into each unit simply to absorb the entire factory cost. |
| Automated standard-cost systems can preserve stale assumptions | A standard cost is useful only if its material, labor, and overhead assumptions still approximate current economics for the model’s purpose. |
| Google’s 2026 AI search guidance emphasizes unique expert-led content | Original frameworks, worked cost bridges, real decision scenarios, and observable staff competencies are more useful than another glossary of accounting terms. |
Chart: Where Cost-Accounting Judgment Concentrates
SkillAbility training heat map—not a FASB ranking. Actual judgment depends on industry, production process, capacity, cost system, accounting policy, product mix, and decision purpose.
The COST READY Framework
| Stage | Staff Question | Review Evidence |
|---|---|---|
| C — Clarify the decision & reporting purpose | Is this GAAP inventory costing, management analysis, pricing, or tax? | Purpose / policy statement |
| O — Organize direct, indirect, product & period costs | What does each cost represent and where does it belong? | Cost classification matrix |
| S — Separate fixed, variable & mixed behavior | How does each cost change with activity? | Cost behavior schedule |
| T — Trace direct costs to units, jobs or services | Which costs can be economically traced? | Material / labor / job detail |
| R — Relate overhead pools to defensible drivers | What activity actually causes or explains indirect cost? | Pool / driver analysis |
| E — Establish standards, capacity & unit cost | Do standard or actual cost assumptions reflect normal economics? | Cost sheet / standard validation |
| A — Analyze purchase, labor & overhead variances | Why did actual cost differ from expectation? | Variance bridge |
| D — Diagnose gross margin & contribution margin | What drove the change in profitability? | Margin bridge |
| Y — Yield unit economics, break-even & decision insight | What does each unit contribute after its truly variable cost? | Unit economics / CVP analysis |
| R — Reconcile the model to inventory, COGS & GL | Does the managerial model connect back to reported results? | Cost-model reconciliation |
| E — Evaluate abnormal, stale & nonrelevant costs | Are we capitalizing or allocating costs that should be challenged? | Exception analysis |
| A — Assemble reviewer-ready explanation | Can another accountant reproduce the margin conclusion? | Review memo / dashboard |
| D — Develop next-period cost controls | What standard, driver, price, labor or process assumption needs updating? | Action / control log |
| Y — Year-round cost ownership | Is the cost model maintained between year-end closes? | Monthly owner calendar |
Three Cost Lenses Staff Must Not Confuse
1. U.S. GAAP financial-reporting cost
ASC 330 addresses inventory cost for external financial reporting. Inventory generally reflects costs applicable to goods on hand after costs associated with sold goods are matched with revenue. For manufacturers, product cost can include direct materials, direct labor, variable production overhead, and allocated fixed production overhead under the entity’s approved accounting method.
2. Managerial cost
Management may reorganize cost differently for pricing, make-or-buy decisions, customer profitability, product-line profitability, capacity decisions, break-even analysis, sales compensation, and channel decisions. A contribution-margin report may exclude fixed manufacturing overhead from variable cost even though that fixed production overhead is relevant to absorption costing for external inventory accounting.
3. Tax capitalization
Section 263A can require taxpayers within scope to capitalize direct costs and certain indirect costs properly allocable to production or resale activities.
O + S — Classify Cost Before You Allocate It
Direct vs. indirect
A direct cost can be traced economically to a cost object such as a product, job, customer, project, or service. Examples include material in a manufactured unit or technician hours on a specific customer job. An indirect cost benefits multiple cost objects and usually requires allocation, such as factory rent, production supervisor salary, shared depreciation, or warehouse utilities.
Product vs. period
Product cost is associated with inventory or production under the applicable accounting model. Period cost is recognized in the period. The distinction is not simply “factory = product, office = period.” Staff need to understand what the cost supports and what the accounting guidance requires.
Fixed vs. variable
Variable cost changes with the relevant activity level within the relevant range. Fixed cost remains relatively unchanged in total within that range. Mixed and step costs require more judgment.
| Cost | Direct / Indirect | Product / Period | Likely Behavior |
|---|---|---|---|
| Raw material | Direct | Product | Variable |
| Assembly labor | Direct | Product | Often variable or step-variable |
| Factory rent | Indirect | Product allocation under absorption model | Fixed |
| Sales commission | Can be direct to sale/customer | Period / selling | Variable |
| Corporate CFO salary | Indirect | Period | Fixed |
Mixed and step costs
A maintenance contract might have a $5,000 monthly base fee plus $2 per machine hour. A supervisor salary may be fixed for 1–20 employees but jump when a second supervisor becomes necessary. Staff should document the relevant range rather than label every cost fixed or variable forever.
T + E — Build a Defensible Unit Cost
Assume a manufacturer produces 10,000 units with $240,000 direct material, $160,000 direct labor, $50,000 variable production overhead, and $100,000 allocated fixed production overhead.
The staff accountant should then challenge the inputs: Is the production quantity valid? Are material quantities and purchase prices current? Does labor include productive and nonproductive time appropriately? Does variable overhead actually vary with the selected driver? Is fixed overhead based on normal capacity? Are abnormal idle time, spoilage, or inefficiency being capitalized?
R — Overhead Allocation: Cost Pools Need Causal Logic
Overhead is where cost accounting can become arbitrary. A defensible model begins with two questions: Which indirect costs belong in the same pool? Which activity best explains consumption of that pool?
Common drivers
- Direct labor hours
- Machine hours
- Units produced
- Production runs
- Purchase orders
- Setups
- Square footage
- Service tickets
- Labor dollars
Simple overhead-rate example
Assume annual machine-related overhead of $900,000 and normal machine activity of 30,000 hours.
A product consuming 2.5 machine hours receives:
When one driver distorts economics
If Product A is labor-intensive and Product B is highly automated, allocating all factory overhead using direct labor hours may push too much cost to A and too little to B. A multi-pool or activity-based approach may better explain resource consumption.
Activity-based costing can group costs around setups, inspections, purchase processing, engineering changes, or customer support. It can create better management insight, but the model still needs to reconcile back to the financial statements. A useful managerial allocation does not automatically redefine GAAP inventory cost.
Normal Capacity: Do Not Capitalize Idle Operations Into a Better Margin
Fixed manufacturing overhead requires special judgment when production changes. Current financial-reporting guidance emphasizes that fixed overhead allocation should reflect normal production levels.
Assume annual fixed factory overhead of $1,200,000 and normal capacity of 120,000 units.
A supply disruption reduces actual production to 70,000 units. If staff simply divide total fixed overhead by actual production, the rate jumps to $17.14 per unit. That would push abnormal idle-capacity cost into inventory.
The abnormal unallocated amount is generally recognized in the period rather than capitalized simply because fewer units were produced.
E + A — Standard Costing: Standards Must Still Mean Something
Standard costing can make a large operation controllable because the ERP does not need to reconstruct actual cost for every unit in real time. But the standards need governance.
A standard cost can include standard material quantity × standard material price, standard labor hours × standard labor rate, standard variable-overhead usage × standard variable-overhead rate, and standard fixed-overhead allocation.
Current inventory guidance describes standard costing as a technique using predetermined material, labor, and overhead rates at normal output and efficiency.
Purchase price variance
Example: standard material price $8.00, actual price $8.60, actual quantity 20,000 units.
Labor rate variance
Labor efficiency variance
Variable and fixed overhead
Depending on the system, staff may analyze variable-overhead spending, variable-overhead efficiency, fixed-overhead spending, and fixed-overhead volume/capacity variance.
A variance is not an answer
A $12,000 unfavorable purchase-price variance could result from a supplier price increase, tariff, expedited shipping embedded in purchase price, lower purchase volume, a different material grade, or an obsolete standard. The accounting value of variance analysis comes from explaining cause.
D — Gross Margin: Explain the Bridge, Not Just the Percentage
Gross margin is one of the most visible outputs of the cost-accounting system. A month-to-month movement can reflect selling-price changes, discounts, product mix, material prices, labor rates, labor efficiency, freight, tariffs, overhead absorption, standard-cost updates, inventory write-downs, shrinkage, or cutoff.
Margin bridge example
Prior-month gross profit is $420,000 and current-month gross profit is $350,000. The $70,000 decline should be explained rather than merely reported.
| Driver | Gross Profit Impact | Evidence |
|---|---|---|
| Price increases | +$35,000 | Sales price/mix report |
| Unfavorable product mix | ($28,000) | Volume by SKU |
| Material / tariff increase | ($32,000) | PPV / landed cost |
| Labor inefficiency | ($15,000) | Labor efficiency report |
| Underabsorbed overhead | ($20,000) | Capacity analysis |
| Other / rounding | ($10,000) | Detailed reconciliation |
| Total movement | ($70,000) | Ties to P&L |
That explanation is much more valuable than “gross margin was 31.4% this month.”
Y — Contribution Margin and Unit Economics
Contribution margin is a managerial measure that asks how much revenue remains after variable costs to cover fixed costs and profit.
Assume selling price per unit of $120, variable material $35, variable labor $18, variable overhead $7, and variable sales commission $6.
Gross margin is not contribution margin
If absorption costing includes $14 of fixed factory overhead in COGS, gross profit per unit may be $46 while contribution margin remains $54 if the fixed factory cost does not change with one incremental unit inside available capacity. Both metrics can be useful. They answer different questions.
Unit economics should include the right variable costs
For an e-commerce business, variable economics may include product cost, payment processing, outbound shipping, pick/pack, returns, sales commissions, and marketplace fees. For a professional service, the relevant variable or incremental economics may focus on service labor, contractors, transaction usage fees, and customer-specific fulfillment.
Do not assume “direct” means variable
A salaried professional can be directly assigned to a client but still represent fixed or step-fixed cost in the short term.
Break-Even and Margin of Safety
If annual relevant fixed costs are $1,350,000 and contribution margin is $54 per unit:
If expected sales are 32,000 units:
Break-even is only as good as the assumptions
Staff should challenge whether selling price is constant, product mix is stable, variable costs are linear, fixed costs remain fixed, and extra capacity would require another shift, supervisor, or facility.
Price, Volume, Mix, and Efficiency: Turn Margin Movement Into Causes
When management asks, “Why did margin change?” a strong cost accountant does not answer with one blended percentage. Separate the price effect, volume effect, mix effect, cost-rate effect, efficiency effect, and capacity/absorption effect.
Price effect: How much changed because selling prices changed?
Volume effect: How much changed because more or fewer units were sold?
Mix effect: How much changed because mix shifted toward higher- or lower-margin products?
Cost-rate effect: How much changed because material, labor, freight, or overhead rates changed?
Efficiency effect: How much changed because the business used more or fewer resources per unit?
Capacity effect: How much changed because production volume changed fixed-overhead absorption?
Customer, Job, Location, and Channel Profitability
Product profitability is only one dimension. A customer can buy a high-gross-margin product and still be unprofitable if the customer generates high returns, small orders, expedited freight, excess support, custom packaging, or unusual commissions. A job can show revenue above direct labor yet consume disproportionate project-management time. A retail location can have a positive store contribution before corporate overhead but appear unprofitable after an arbitrary corporate allocation.
Build profitability in layers
That layered view prevents management from confusing “fully allocated loss” with “this customer destroys economic contribution.”
Relevant-Cost Decisions: Full Cost Can Answer the Wrong Question
Special order
If spare capacity exists, a special order may be attractive when incremental revenue exceeds incremental cost—even if the price is below fully absorbed cost. Staff should also consider opportunity cost, future pricing impact, customer/channel conflict, incremental setup or freight, and capacity constraints.
Make or buy
The avoidable cost of making should be compared with the purchase alternative, not automatically the fully absorbed manufacturing cost.
Drop a product line
If allocated corporate cost remains after a product is discontinued, eliminating a product that appears unprofitable after allocations can reduce total company profit.
R — Reconcile the Cost Model to Inventory, COGS, and the General Ledger
A managerial cost model can use different classifications than the financial statements, but it should still reconcile.
The cost-model reconciliation should explain standard cost versus actual cost, capitalized versus expensed variances, inventory write-downs, abnormal overhead, freight/tariffs, shrinkage, managerial reclassifications, fixed-versus-variable regrouping, and non-GAAP allocations.
| Item | Amount |
|---|---|
| GAAP COGS | $3,800,000 |
| Less fixed manufacturing overhead for contribution view | ($420,000) |
| Add variable outbound fulfillment classified below gross profit in GAAP P&L | $280,000 |
| Managerial variable cost | $3,660,000 |
That bridge lets management use contribution margin without pretending contribution margin equals GAAP gross profit.
Book Cost Versus Section 263A Tax Capitalization
Cost accountants working with tax teams should know that tax capitalization can differ from financial-reporting inventory cost. IRS guidance states that taxpayers subject to §263A generally capitalize direct costs of property produced or acquired for resale and certain indirect costs properly allocable to production or resale activities.
Depending on the taxpayer and method, tax-capitalizable indirect cost can include certain administrative costs, taxes, depreciation, insurance, officer compensation attributable to production/resale activity, and rework labor. Small-business exceptions and accounting-method rules can apply.
Worked Example: From Unit Cost to Margin, Contribution, and Break-Even
Assume Product A has a selling price of $150 per unit, direct material $42, direct labor $24, variable manufacturing overhead $9, allocated fixed manufacturing overhead $15, variable selling/fulfillment $8, and annual product-line traceable fixed operating costs of $900,000.
Step 1 — absorption product cost
Step 2 — gross profit per unit
Step 3 — managerial variable cost
Step 4 — contribution margin
Step 5 — product-line break-even
Step 6 — now change one fact: material cost rises $6 because of tariffs
New variable cost becomes $89 and contribution margin becomes $61.
A $6 cost increase did more than reduce margin per unit. It increased the volume required to cover fixed costs by roughly 1,321 units.
Now change one fact: the business has idle capacity and receives a 5,000-unit special order at $110
If the truly incremental costs remain $83 and no meaningful opportunity cost or strategic downside exists:
Rejecting the order merely because $110 is below fully allocated cost could be the wrong decision.
Cost Accounting Self-Review Checklist Before Manager Review
- Did I define the purpose of the cost model?
- Is this financial reporting, managerial analysis, pricing, budgeting, or tax?
- Did I identify the correct cost object: unit, product, job, customer, location, or service?
- Did I distinguish direct from indirect costs?
- Did I distinguish product from period costs?
- Did I distinguish fixed, variable, mixed, and step costs?
- Did I define the relevant range for cost behavior?
- Did I avoid assuming all direct costs are variable?
- Did I avoid assuming all indirect costs are fixed?
- Did I trace direct materials to source records?
- Did I validate bills of material or usage assumptions?
- Did I trace direct labor to time or production support?
- Did I validate labor rates?
- Did I identify overtime, idle time, rework, and inefficiency?
- Did I identify variable production overhead?
- Did I identify fixed production overhead?
- Did I separate selling/admin cost from production cost appropriately?
- Did I identify abnormal production costs?
- Did I use normal-capacity logic for fixed-overhead allocation where required?
- Did I identify unallocated fixed overhead arising from abnormal low production?
- Did I avoid increasing unit cost just to absorb all fixed factory cost?
- Did I define each overhead cost pool?
- Did I select a driver that reasonably relates to consumption of the pool?
- Did I consider whether one driver distorts products with different production characteristics?
- Did I consider multiple pools or activity-based costing for managerial insight?
- Did I document why the driver was selected?
- Did I reconcile total allocated overhead to the overhead pool?
- Did I identify overapplied or underapplied overhead?
- Did I verify the approved inventory cost-flow method where relevant?
- If standard cost is used, did I review the standard material price?
- Did I review standard material quantity?
- Did I review standard labor rate?
- Did I review standard labor hours?
- Did I review standard overhead assumptions?
- Did I determine when standards were last updated?
- Did I calculate material purchase-price variance where relevant?
- Did I calculate material usage variance where relevant?
- Did I calculate labor rate variance?
- Did I calculate labor efficiency variance?
- Did I analyze variable-overhead variance?
- Did I analyze fixed-overhead spending/capacity variance?
- Did I identify whether variances result from operations or stale standards?
- Did I explain material unfavorable and favorable variances?
- Did I avoid treating favorable variance as automatically “good”?
- Did I reconcile standard cost to GAAP carrying value?
- Did I reconcile inventory cost to COGS?
- Did I reconcile the cost model to the GL?
- Did I identify manual cost/COGS adjustments?
- Did I review gross-margin changes by price, volume, mix, cost rate, efficiency, and capacity?
- Did I avoid plugging cost to achieve an expected gross margin?
- Did I calculate gross margin consistently?
- Did I distinguish gross margin from contribution margin?
- Did I define truly variable cost for the managerial model?
- Did I include variable selling/fulfillment costs where relevant to unit economics?
- Did I calculate contribution margin per unit?
- Did I calculate the contribution-margin ratio?
- Did I calculate break-even volume using relevant fixed cost?
- Did I calculate margin of safety where useful?
- Did I test whether fixed and variable assumptions remain valid over the modeled volume range?
- Did I analyze product/customer/job/location profitability in meaningful layers?
- Did I separate traceable fixed cost from allocated shared cost?
- Did I consider opportunity cost in short-term decisions?
- Did I avoid using fully absorbed cost as the automatic answer to make/buy or special-order decisions?
- Did I identify capacity constraints?
- Did I distinguish sunk cost from avoidable future cost?
- Did I reconcile managerial contribution cost to GAAP COGS?
- Did I identify §263A tax-capitalization differences for the tax team where applicable?
- Did I identify small-business or method issues requiring tax review?
- Did I document assumptions, sources, driver logic, and open issues?
- Can another accountant reproduce the unit cost and margin explanation without rebuilding the model?
100-Point Cost Accounting Readiness Scorecard
| Capability | Points | Observable Evidence |
|---|---|---|
| Purpose / cost classification | 10 | Correctly separates GAAP, managerial, and tax objectives plus direct/indirect and fixed/variable behavior |
| Direct material / labor tracing | 10 | Unit or job cost ties to source quantities and rates |
| Overhead pool / driver judgment | 14 | Pools and drivers have defensible causal logic |
| Normal capacity / abnormal costs | 10 | Fixed overhead and abnormal costs are treated appropriately |
| Standard cost / variance analysis | 14 | Standards remain supportable and variances are explained by cause |
| Gross-margin bridge | 12 | Price, volume, mix, rate, efficiency, and capacity effects explain P&L movement |
| Contribution margin / unit economics | 12 | Variable economics and decision horizon are clearly defined |
| Break-even / relevant-cost decisions | 8 | Models reflect relevant costs, capacity, and opportunity cost |
| Inventory / COGS / GL reconciliation | 7 | Managerial cost models reconcile to reported financials |
| Documentation / escalation | 3 | Assumptions, tax differences, and specialized issues are surfaced |
- 90–100: Ready to own defined recurring cost and margin analysis with normal manager review.
- 82–89: Generally review-ready; targeted coaching remains in overhead, variances, or decision modeling.
- 72–81: Controlled ownership with manager checkpoints before standards, allocations, or management decisions are finalized.
- Below 72: Continue structured cost-accounting practice.
Override the numerical score for intentional margin manipulation, unsupported overhead drivers, deliberate capitalization of abnormal cost, cost plugs, manipulated standards, or managerial cost reports presented as GAAP without reconciliation.
A 30/60/90-Day Cost Accounting Training Plan
| Period | Development Goal | Practice | Evidence |
|---|---|---|---|
| Days 1–30 | Understand cost structure | Direct/indirect, product/period, fixed/variable, unit cost, basic overhead and margin | Three complete cost builds |
| Days 31–60 | Own variance and margin analysis | Standards, PPV, labor, overhead, gross-margin bridges, contribution margin | Review-ready monthly cost package |
| Days 61–90 | Use cost data for judgment | Break-even, customer/job economics, capacity, make/buy, special orders, GAAP-vs-management-vs-tax bridges | Observed decision support and escalation |
15 Realistic Cost Accounting Training Scenarios
1. The product that became “profitable” after an overhead-driver change
Management switches all factory overhead from machine hours to direct labor hours. Staff tests whether the new driver improves causal accuracy or merely shifts cost away from a favored product.
2. The low-volume month that improves gross margin
Production falls sharply, but unit inventory cost increases because staff allocates all fixed overhead across fewer units. Staff identifies the normal-capacity problem.
3. The favorable purchase-price variance caused by lower quality
Materials cost less than standard, but scrap and labor time increase. Staff refuses to call the PPV favorable without analyzing total economics.
4. The old standard cost
The ERP standard has not been updated in 18 months while wage rates and tariffs changed materially. Staff distinguishes operating variance from stale standard.
5. Gross margin dropped even though prices increased
Staff builds a bridge and finds that product mix, materials, and underabsorbed overhead outweighed the pricing benefit.
6. The “unprofitable” customer with positive contribution
Corporate overhead allocation makes the customer look negative, but customer-specific variable and traceable fixed costs show positive incremental economics.
7. The special order below full cost
A factory has idle capacity and receives a one-time order below fully absorbed unit cost but above incremental variable cost. Staff identifies relevant costs and opportunity costs.
8. The make-or-buy analysis that assumes factory rent disappears
A vendor quote appears cheaper because the internal model includes rent that will continue even if production is outsourced.
9. The highest-gross-margin product that consumes the most support
Activity-based analysis shows that frequent setups, inspections, and engineering changes materially reduce product economics.
10. Sales commission missing from unit economics
The product has strong gross margin but a high variable marketplace or commission fee. Contribution margin tells a different story.
11. The direct salaried employee
A salaried technician is directly assigned to customers. Staff distinguishes direct traceability from short-term cost behavior.
12. Tax cost does not match book cost
The tax team asks for §263A support. Staff gives a reconciliation rather than forcing the GAAP cost model to equal the tax capitalization method.
13. The favorable labor-efficiency variance caused by unrecorded rework
Reported production hours look efficient because rework was coded to overhead. Staff follows the cost to its economic cause.
14. The product-line shutdown that makes company profit worse
A product looks unprofitable after allocated headquarters cost. Once removed, the shared cost remains and lost contribution reduces total profit.
15. The “margin fix” journal entry
A manager asks accounting to capitalize $150,000 of factory cost to bring gross margin back to budget. Staff goes back to inventory, capacity, and cost evidence rather than booking a plug.
What CPA Firms Should Measure
| Metric | What It Reveals |
|---|---|
| Cost-classification corrections in review | Foundational cost-accounting competence |
| Overhead-driver corrections | Allocation judgment |
| Standard-cost age | Whether cost assumptions stay current |
| Unexplained PPV / labor / overhead variance | Root-cause discipline |
| Gross-margin movement unexplained | Ability to translate operations into P&L |
| Managerial model-to-GL reconciling items | Financial-control quality |
| Abnormal overhead capitalized in review | Capacity / margin-management risk |
| Decision models missing relevant cost | Business-advisory readiness |
| Tax capitalization bridge corrections | Book-tax handoff quality |
| Manager reconstruction hours | Whether staff own the economics |
Connect these measures to your Staff Accountant Competency Checklist, Accounting Employee Development Plan, and Accountants Shifting From Preparers to Reviewers.
Common Cost Accounting Training Mistakes
Mistake 1: Teach formulas without purpose
Staff can calculate overhead and contribution margin but do not know which accounting or decision question each formula answers.
Mistake 2: Treat every cost as fixed forever or variable forever
Cost behavior depends on activity driver, time horizon, and relevant range.
Mistake 3: Use one overhead driver because it is easy
The model becomes computationally simple and economically misleading.
Mistake 4: Absorb abnormal low-volume cost into inventory
Current margin improves at the cost of overstated unit cost and deferred expense.
Mistake 5: Treat standard cost as actual truth
Standards become stale while purchasing, wages, engineering, freight, and capacity change.
Mistake 6: Celebrate favorable variance without understanding it
A favorable purchase price can create unfavorable quality, scrap, or labor economics.
Mistake 7: Report gross margin without a bridge
Management receives the outcome but not the causes.
Mistake 8: Use gross margin and contribution margin interchangeably
Financial-reporting product cost and decision-variable cost answer different questions.
Mistake 9: Allocate all corporate overhead and call the result incremental profit
Shared cost that will remain can distort customer and product decisions.
Mistake 10: Use the same cost report for GAAP, management, and tax
A single report cannot automatically satisfy three different measurement objectives.
How SkillAbility Builds Cost Accounting Capability
BASE — Cost execution
Develop direct vs indirect, product vs period, fixed vs variable, unit-cost builds, overhead rates, standard-cost mechanics, and basic COGS and margin reconciliation.
MAPS — Cost judgment
Develop driver selection, normal capacity, variance root causes, gross-margin bridges, contribution margin, unit economics, customer/job profitability, break-even, and make/buy or special-order reasoning.
SUMMIT — Reviewer and advisory readiness
Develop future managers who can challenge cost architecture, review standard resets, connect operations to margin, identify margin-management risk, review profitability by product/customer/channel, coordinate book-tax capitalization, support pricing and capacity decisions, and coach staff without rebuilding the cost model.
Frequently Asked Questions About Cost Accounting Training
What is cost accounting?
Cost accounting is the process of identifying, classifying, tracing, allocating, measuring, and analyzing costs associated with products, services, jobs, customers, locations, or other cost objects.
What should cost accounting training include?
It should include direct and indirect cost, product and period cost, fixed and variable behavior, unit costing, overhead allocation, standard cost, variance analysis, gross margin, contribution margin, break-even, unit economics, and reconciliation to financial reporting.
What is the difference between direct and indirect cost?
Direct cost can be economically traced to a specific cost object. Indirect cost benefits multiple cost objects and usually requires allocation.
What is the difference between fixed and variable cost?
Variable cost changes with activity within a relevant range, while total fixed cost generally remains stable within that range. Mixed and step costs contain both or change in blocks.
What is product cost?
Product cost is cost associated with producing or acquiring inventory under the applicable accounting model. For manufactured inventory it can include direct materials, direct labor, and appropriate production overhead.
What is an overhead allocation rate?
An overhead allocation rate divides an indirect cost pool by an appropriate cost driver such as labor hours, machine hours, setups, or units, depending on the economics of the pool.
What is normal capacity in cost accounting?
Normal capacity is a production level expected under normal operating conditions over an appropriate period. It helps prevent abnormally low production from inflating fixed overhead capitalized per unit.
What is standard cost?
Standard cost is a predetermined unit cost built from expected material, labor, and overhead quantities/rates at normal levels of output and efficiency. Standards need periodic validation.
What is purchase price variance?
Purchase price variance measures the difference between actual purchase price and standard purchase price multiplied by actual quantity purchased.
What is labor efficiency variance?
Labor efficiency variance measures the cost effect of using more or fewer labor hours than the standard hours allowed for actual production.
What is gross margin?
Gross margin is net sales less cost of goods sold. Gross margin percentage is gross margin divided by net sales.
What is contribution margin?
Contribution margin is revenue less variable costs. It shows how much revenue remains to cover fixed costs and profit.
Is gross margin the same as contribution margin?
No. Gross margin generally uses financial-reporting COGS, while contribution margin reorganizes cost by behavior and subtracts variable costs.
What is unit economics?
Unit economics measures the revenue and relevant costs associated with one unit, order, customer, job, subscriber, or other meaningful business unit.
What is the break-even formula?
Break-even units equal relevant fixed costs divided by contribution margin per unit.
What is margin of safety?
Margin of safety is the amount by which expected or actual sales exceed break-even sales, expressed in units, dollars, or percentage.
What is activity-based costing?
Activity-based costing allocates indirect costs through activity pools and activity drivers such as setups, purchase orders, inspections, or support interactions.
Why can fully allocated cost be misleading for decisions?
Fully allocated cost can include fixed/shared cost that will not change if a particular short-term decision is made. Relevant-cost analysis focuses on future costs and benefits that differ between alternatives.
How does cost accounting relate to ASC 330?
ASC 330 provides the U.S. GAAP framework for inventory accounting. Cost accounting supplies operational quantities, rates, overhead allocations, standards, and reconciliations used to support inventoriable cost and COGS.
How is tax cost different from book cost?
Tax rules such as §263A can require capitalization of direct and certain indirect costs using tax methods that do not necessarily match the company’s U.S. GAAP or managerial cost model.
How do you know when an accountant is review-ready in cost accounting?
A review-ready accountant can define the purpose of the model, classify and trace costs, select defensible overhead drivers, validate standards and capacity, explain variances and margin movement, build unit economics, reconcile the model to financial statements, and escalate specialized tax or accounting issues.
Current Research and Authority Resources
- Deloitte DART — ASC 330 Inventory
- KPMG — Handbook: Inventory, October 2025
- KPMG — Inventory Accounting: IFRS Standards vs. U.S. GAAP, June 2026
- KPMG — Effects of Tariffs on Financial Reporting, 2026
- IRS — Form 1120-S Instructions: Section 263A Uniform Capitalization
- Corporate Finance Institute — Contribution Margin
- Corporate Finance Institute — Break-Even Analysis
- Google Search Central — Optimizing for Generative AI Features
- Google Search Central — Generative AI Performance Reports
Cost accounting can intersect with ASC 330 inventory, ASC 606 revenue, ASC 340 contract costs, ASC 842 lease costs, ASC 360 fixed assets/impairment, ASC 250 accounting-method consistency, federal tax capitalization under §263A, transfer pricing, and industry-specific accounting. Verify applicable authoritative literature and company policy for live work.
The Bottom Line
Cost accounting training should not produce staff who know how to divide overhead by a driver. It should produce accountants who can explain the economics behind the number.
Clarify the purpose.
Classify the cost correctly.
Trace what can be traced.
Allocate what must be allocated using defensible drivers.
Use normal capacity.
Challenge standards.
Explain variances.
Bridge margin.
Separate gross margin from contribution margin.
Model unit economics and break-even.
Use relevant costs for decisions.
Reconcile management analysis back to the financial statements.
Keep book and tax cost connected—but not artificially identical.
That is COST READY.
Protect Knowledge. Develop People. Scale the Firm.
Can Your Staff Explain Why Margin Changed—or Only Tell You What the Margin Is?
SkillAbility helps accounting firms develop staff who can move from materials, labor, overhead, standards, and variances to gross-margin explanations, contribution economics, break-even analysis, and review-ready cost models.
Book Your Free 10-Minute Structural Alignment Review →
Includes our 45-Day Out-of-Pocket Performance Guarantee.
To staff who can explain the cost before management makes a decision from it,
Vincent Howard, CPA
Managing Partner, Howard, Howard and Hodges
SkillAbility for Accounting Firms
About the Author
Vincent Howard, CPA has practiced public accounting since 1990. He earned a Bachelor of Science in Accounting and a Master’s in Taxation from the University of Central Florida, founded his accounting firm in 1993, and serves as Managing Partner of Howard, Howard and Hodges. He helped grow the organization from three people to approximately 50 staff across multiple Florida locations and states. He has participated in PASBA since 1997, and the firm was named PASBA Firm of the Year in 2015. Since 2020, he has built and run the SkillAbility accounting workforce-development platform to help firms convert accounting knowledge into structured staff capability.
How This Guide Was Developed
This guide combines Vincent Howard’s public-accounting and workforce-development experience with current ASC 330 inventory guidance, KPMG’s October 2025 inventory handbook and June 2026 inventory guidance, current 2026 production-capacity and tariff considerations, IRS §263A capitalization guidance, managerial contribution-margin and break-even concepts, and SkillAbility’s close, workpaper, scenario-training, and reviewer-development frameworks. COST READY and the 100-point readiness scorecard are SkillAbility teaching frameworks designed to turn cost calculations into observable accounting and business judgment.
© 2026 SkillAbility for Accounting Firms. This article provides general educational information and does not replace client-specific U.S. GAAP, tax, audit, pricing, legal, operational, or other professional advice.