

 By Vincent Howard, CPA | Managing Partner, Howard, Howard and Hodges | SkillAbility for Accounting Firms
Last updated: August 7, 2026 | 45-minute read
- What KPI advisory training means
- Why this capability matters now
- Metric versus KPI versus dashboard
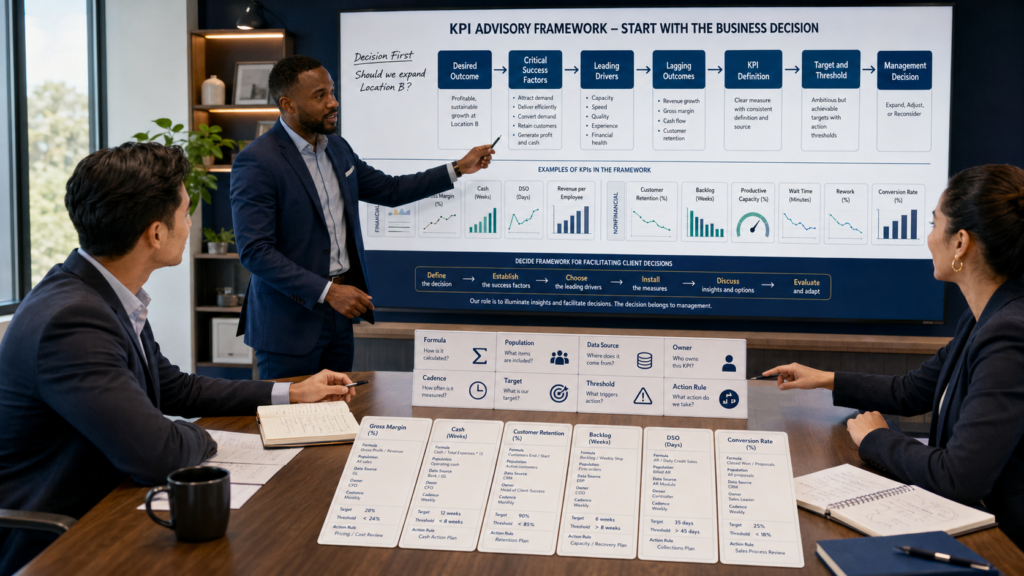
- The DECIDE framework
- Start with the client decision
- Critical success factors and value drivers
- Leading and lagging indicators
- Financial and nonfinancial KPIs
- Build a KPI driver tree
- Create a KPI definition card
- Targets, thresholds, and benchmarks
- Segment the metric when totals hide the answer
- Design a decision dashboard
- Lead the KPI advisory meeting
- Industry-specific KPI selection
- Avoid metric gaming and unintended behavior
- Scope, data, and professional boundaries
- Technology, automation, and AI
- Worked client example
- The KPI advisory dashboard
- 90-day implementation plan
- 30-day accountant training plan
- 30/60/90-day live-work progression
- 100-point readiness scorecard
- Realistic KPI advisory scenarios
- What the firm should measure
- Common KPI advisory mistakes
- Frequently asked questions
A business owner opens a dashboard.
It contains 26 metrics:
- Revenue
- Gross margin
- EBITDA
- Current ratio
- Quick ratio
- DSO
- DPO
- Cash conversion cycle
- Revenue per employee
- Overtime
- Average ticket
- Customer count
- Customer retention
- New leads
- Close rate
- Website traffic
- Utilization
- Backlog
- Labor efficiency
- Inventory turns
- Refund rate
- Budget variance
- Cash balance
- Debt service coverage
- Headcount
- Employee turnover
The dashboard is impressive.
The owner asks:
“Which one tells me whether I should hire another service manager?”
If the accountant cannot answer, the dashboard is reporting data—not advising management.
The best KPI is not the most sophisticated metric. It is the metric that helps management recognize a condition early enough to make a better decision.
Who I Am and Why This Matters
I have practiced public accounting since 1990. I founded my accounting firm in 1993, merged it in 2001 to form Howard, Howard and Hodges, and helped grow the organization from three people to approximately 50 staff across multiple Florida locations and states. Our firm was named PASBA Firm of the Year in 2015.
Accountants have always worked with measures.
We calculate:
- Margins
- Ratios
- Variances
- Turnover
- Days outstanding
- Productivity
- Budget-to-actual
The advisory challenge is different.
It is deciding which measures deserve management attention.
A client does not need every ratio an accounting system can produce. The client needs a small number of measures that explain whether the business is moving toward or away from an important outcome and what management can still do about it.
Since 2020, I have built and run the SkillAbility accounting workforce development platform, used by more than 1,000 accounting professionals across dozens of PASBA firms.
Read Accounting Workforce Development for building the structured progression from technical execution to advisory judgment and leadership.
That experience has reinforced a practical advisor-development principle:
Accountants become advisors when they stop treating the dashboard as the deliverable and start treating the client decision as the deliverable.
Read How Accountants Identify Advisory Opportunities Inside Compliance Work for recognizing which client signals deserve deeper business analysis.
What Is KPI Advisory Training for Accountants?
KPI advisory training develops an accountant’s ability to connect a client’s strategy and critical success factors to a small set of reliable financial and nonfinancial measures; define targets, thresholds, ownership, and actions; interpret results in context; and use those measures to support recurring management decisions.
KPI advisory is not ratio calculation
An accountant can calculate dozens of metrics correctly and still fail to create advisory value.
The advisory work begins when the accountant can explain:
- Why the metric matters
- Which business outcome it influences
- Which operational driver causes it to move
- What management can control
- What threshold requires action
- What decision the metric supports
KPI advisory is not dashboard design
A dashboard is a delivery format.
A KPI system is a management system.
The dashboard may visualize:
- Actual result
- Target
- Trend
- Variance
- Segment
- Threshold
But the system must also define:
- Formula
- Data source
- Owner
- Frequency
- Interpretation
- Action rule
- Review cadence
KPI advisory is not management
The accountant can recommend measures, build analyses, identify patterns, frame alternatives, and facilitate management discussions.
Management remains responsible for:
- Strategy
- Goals
- Operating decisions
- People decisions
- Implementation
- Accepting business risk
Why KPI Advisory Capability Matters Now
CAS is explicitly moving toward performance evaluation and forward-looking decision support
AICPA & CIMA’s current CAS Chief Value Officer curriculum teaches professionals to evaluate business performance using traditional financial measures, identify linkages between critical success factors and key performance indicators, and use performance information to define organizational information needs.
Official source: AICPA & CIMA CAS CVO I.
Nonfinancial measures matter because financial statements do not capture every driver of value
AICPA & CIMA’s guidance on developing nonfinancial KPIs emphasizes that future value creation often depends on nonfinancial or intangible business drivers in addition to traditional financial measures.
Official source: How to develop non-financial KPIs.
Dashboards are becoming more interactive and decision oriented
Journal of Accountancy guidance published in February 2026 shows how interactive dashboards can let decision-makers explore revenue, budget, cost, internal-audit, and management-reporting data dynamically instead of receiving multiple static reports.
Source: Create interactive dashboards with Excel PivotCharts and slicers.
Current financial-analysis guidance emphasizes identifying patterns and red flags—not simply calculating ratios
Journal of Accountancy guidance published in June 2026 describes combining horizontal, vertical, ratio, and trend analysis in dashboards to highlight patterns that warrant further investigation.
Source: Using Excel to identify financial statement red flags.
Industry specialization makes KPI selection more meaningful
CPA.com reported in 2025 that 77 percent of CAS practices in the 2024 CPA.com and AICPA PCPS benchmark survey reported movement toward verticalization. Industry focus can make it easier to identify repeatable operating drivers, benchmarks, and decision patterns across similar clients.
Source: How aligning tech and verticalization fuels CAS growth.
A Useful KPI System Connects Strategy, Operations, and Decisions
Conceptual SkillAbility model. The number and type of KPIs should vary by client, industry, decision, and service scope.
Metric Versus KPI Versus Dashboard
A metric is anything measurable
Examples:
- Website visits
- Invoices sent
- Revenue
- Headcount
- Calls answered
- Units produced
A KPI is a metric tied to an important outcome
A KPI should help management judge whether a critical success factor is on track.
Example:
If the goal is profitable growth in a recurring-service business, revenue alone is not enough.
Management may need:
- Recurring revenue growth
- Gross margin
- Customer retention
- Revenue per service employee
- Backlog or capacity
A dashboard organizes KPIs and supporting metrics
A dashboard may include:
- Primary KPIs
- Diagnostic metrics
- Trend views
- Segment detail
- Drill-downs
Not everything visible should be labeled “key”
If the client has 30 KPIs, the word key has lost meaning.
The DECIDE Framework for KPI Advisory
D-E-C-I-D-E
D — Define the Decision and Desired Outcome
Start with what management needs to decide, improve, protect, or monitor—not with available dashboard widgets.
E — Establish the Critical Success Factors
Identify the small number of conditions that must go well for the client to achieve the outcome.
C — Choose Leading, Lagging, Financial, and Nonfinancial Measures
Balance outcome measures with the operational drivers management can influence early enough to act.
I — Install Definitions, Data, Targets, and Thresholds
Document formula, source, owner, cadence, target, threshold, segment, and response so everyone interprets the KPI consistently.
D — Discuss Drivers, Exceptions, and Decisions
Use advisory meetings to explain why the KPI moved, what could happen next, and what management will do.
E — Evaluate Behavior, Outcomes, and Relevance
Measure whether the KPI changes behavior and improves the intended result; revise or retire metrics that do not.
Start With the Client Decision
Ask what management needs to decide
Examples:
- Should we hire?
- Should we raise prices?
- Should we open another location?
- Which service line should we grow?
- Which customers are becoming less profitable?
- Can we afford a distribution?
- Is production capacity constraining growth?
- Are collections deteriorating?
- Are marketing dollars producing profitable customers?
Do not begin with a generic KPI library
A library is useful for ideas.
It should not determine the dashboard.
The sequence should be:
Define the management question precisely
Weak:
“How is the company doing?”
Stronger:
“Do we have enough profitable demand and service capacity to hire another technician this quarter without reducing cash below our minimum threshold?”
The stronger question suggests the KPIs:
- Booked demand
- Technician capacity
- Utilization or productive hours
- Contribution margin
- Customer wait time
- Cash forecast
Read Cash Flow Advisory Training for Accountants for connecting operational KPIs to cash decisions.
Establish Critical Success Factors Before Selecting KPIs
A critical success factor is a condition that must go well for the client’s strategy or goal to succeed.
Examples
| Client Goal | Possible Critical Success Factors |
|---|---|
| Grow recurring revenue | Retention, new recurring sales, onboarding capacity, service quality |
| Improve cash | Billing speed, collections, inventory or purchasing, margin, spending discipline |
| Increase profitability | Price, volume, labor efficiency, product mix, overhead capacity |
| Open a new location | Demand, staffing, site productivity, startup cash, customer acquisition |
| Reduce customer churn | Service quality, response time, renewal process, product adoption, relationship coverage |
| Improve project delivery | Backlog quality, milestone reliability, rework, staffing, client inputs |
One goal may require several dimensions
Revenue growth without margin can destroy value.
Margin without customer retention may be temporary.
Productivity without quality may create rework.
Utilization without capacity buffers may create burnout or missed deadlines.
Build a balanced view
For a meaningful outcome, consider:
- Financial result
- Customer result
- Operational process
- Capacity and people
- Risk and quality
AICPA & CIMA’s CAS CVO curriculum explicitly links business performance evaluation with critical success factors, KPIs, and traditional financial measures.
Choose Both Leading and Lagging Indicators
Lagging indicators show the result
Examples:
- Revenue
- Gross margin
- EBITDA
- Cash balance
- Customer churn
- Employee turnover
- Net profit
Leading indicators show the drivers or conditions that may create the result
Examples:
- Qualified pipeline
- Sales conversion rate
- Average response time
- Backlog
- Billable capacity
- On-time delivery
- Customer complaints
- Days to invoice
- Past-due receivables
Do not label a metric leading merely because it occurs earlier
A leading indicator should have a credible relationship to the outcome.
For example:
Website visits may occur before sales.
But if visits do not correlate with qualified leads or profitable customers, website traffic may be activity rather than a useful leading KPI.
Use a paired KPI structure
| Outcome | Lagging KPI | Potential Leading KPI |
|---|---|---|
| Cash improvement | Ending cash / operating cash flow | Days to invoice, past-due receivables, collection promises |
| Profitable growth | Revenue growth and contribution margin | Qualified pipeline, price realization, capacity |
| Customer retention | Churn / retention rate | Support response time, product adoption, unresolved issues |
| Project profitability | Project margin | Scope change rate, milestone delay, rework |
| Labor productivity | Revenue or contribution per labor hour | Schedule fill, rework, training readiness, downtime |
Use leading metrics for action and lagging metrics for accountability
The lagging outcome tells management whether the result was achieved.
The leading metric helps management act before the result is final.
Combine Financial and Nonfinancial KPIs
Financial KPIs
Examples:
- Revenue growth
- Gross margin
- Contribution margin
- EBITDA
- Cash flow
- Working capital
- Revenue per employee
- Customer profitability
Nonfinancial KPIs
Examples:
- Customer retention
- Wait time
- On-time delivery
- Backlog
- Units per labor hour
- Employee turnover
- Error or rework rate
- Lead conversion
- Product adoption
- Safety incidents
Why nonfinancial KPIs matter
Financial results often arrive after operational conditions have already changed.
Nonfinancial measures can provide earlier information about:
- Customer behavior
- Capacity
- Quality
- Process efficiency
- Employee capability
- Demand
AICPA & CIMA’s nonfinancial KPI guidance emphasizes that important drivers of future value can sit outside traditional financial statements.
Pair the operational metric with the financial consequence
Example:
Do not show customer response time alone.
Ask:
- Does response time correlate with retention?
- Does retention change recurring revenue?
- What response-time threshold changes staffing decisions?
Build a KPI Driver Tree
A driver tree prevents the dashboard from becoming a random collection of ratios.
Example: Improve operating profit
Example: Improve cash
Example: Improve technician profitability
Driver trees reveal what management can control
If a KPI is too far from operating behavior, management may understand the result but not know how to change it.
Do not confuse mathematical decomposition with causation
A metric can be mathematically related to an outcome without being the true cause of the change.
The accountant should test the relationship using:
- Trend
- Segment analysis
- Operational knowledge
- Client interviews
- Scenario analysis
Create a KPI Definition Card
Every important KPI should have a short operating definition.
| Field | Example: Customer Retention |
|---|---|
| Purpose | Measure whether recurring customers remain active |
| Formula | Customers retained ÷ customers eligible to renew |
| Population | Recurring service customers, excluding one-time clients |
| Source | CRM and billing system |
| Owner | VP of Client Success |
| Frequency | Monthly with rolling 12-month trend |
| Target | Management-approved annual goal |
| Trigger | Below threshold for two months or material cohort deterioration |
| Decision | Investigate service, price, onboarding, or account-management causes |
Define the population
Many KPI disputes are actually denominator disputes.
Examples:
- Which employees count in revenue per employee?
- Which customers count in churn?
- Which jobs count in on-time completion?
- Which leads count in conversion?
Define the data source
Do not calculate the same KPI from different systems without reconciliation.
Define the action rule
If a KPI crosses a threshold and nothing changes, ask whether it is truly key.
Set Targets, Thresholds, and Benchmarks Carefully
Target and threshold are different
- Target: The desired result.
- Threshold: The level at which management should investigate or act.
Example:
A company may target 95 percent on-time delivery but investigate any week below 90 percent.
Use the right comparison
Possible comparisons include:
- Prior period
- Prior year
- Rolling average
- Budget
- Forecast
- Management goal
- Industry benchmark
- Lender covenant
- Internal best-performing segment
Do not use industry averages blindly
A benchmark may differ because of:
- Business model
- Geography
- Customer mix
- Pricing strategy
- Accounting policy
- Company size
- Growth stage
- Seasonality
Use a threshold hierarchy
For each KPI, consider:
- Normal range
- Watch range
- Action range
- Escalation range
Targets should not create destructive incentives
If management targets utilization alone, employees may:
- Avoid training
- Delay automation
- Record time differently
- Protect hours instead of client outcomes
Pair the target with quality and outcome measures.
Segment the KPI When the Total Hides the Decision
Companywide averages can conceal important differences
Examples:
- Total gross margin is stable while one service line is deteriorating.
- Average customer retention is strong while new customers churn rapidly.
- DSO is acceptable overall while the largest customer is severely past due.
- Revenue per employee is rising because overtime and burnout are increasing.
Useful segments
- Customer
- Product
- Service line
- Location
- Channel
- Salesperson
- Employee group
- Customer cohort
- Industry
- Project type
Segment only when it changes the decision
More dimensions create more analytical possibilities but also more noise.
Ask:
“Would management make a different decision if this segment were visible?”
Client segmentation can determine KPI architecture
Strategic advisory clients may require more forward-looking operational and decision KPIs than efficient compliance clients.
Read CPA Firm Client Segmentation Strategy for aligning service, talent, pricing, and relationship models with client value and need.
Design a Dashboard Around Decisions, Not Available Widgets
Use hierarchy
A strong dashboard may have:
- Three to seven primary KPIs
- Supporting diagnostic metrics
- Segment drill-downs
- Action and decision notes
Show context
Do not display:
“Gross margin: 38.4%”
Display:
- Current: 38.4%
- Target: 42%
- Prior year: 41%
- Trend: declining four months
- Primary driver: overtime and material mix
- Decision: pricing and schedule review
Use visual design to direct attention
Current Journal of Accountancy guidance shows that interactive dashboard tools can help decision-makers explore performance by categories such as region, product line, or department.
Good visual design should make:
- Trend
- Variance
- Exception
- Threshold
- Segment difference
easy to see.
Do not use red, yellow, and green without definitions
“Red” should mean something operationally.
Example:
“Red = DSO above 55 days for two consecutive month-ends; collection action plan required.”
Keep diagnostic detail one level below the executive view
The primary dashboard should answer:
- What is off plan?
- Why?
- What decision is needed?
Detailed schedules should support the answer rather than dominate it.
Lead the KPI Advisory Meeting
Do not read the dashboard aloud
The client can see the number.
The accountant should add:
- Context
- Cause
- Implication
- Choice
- Action
Use the five-question KPI discussion
- What changed?
- Why did it change?
- Does it matter?
- What decision does it affect?
- What will management do before the next meeting?
Discuss exceptions first
Begin with:
- Threshold breaches
- Unexpected trends
- Large segment differences
- Forecast variance
- Decisions due soon
Separate explanation from recommendation
Example:
Explanation: “Gross margin fell from 42 percent to 37 percent because overtime and subcontractor use increased in two locations.”
Recommendation: “I recommend management compare price, schedule, staffing, and subcontractor economics before accepting the next similar jobs.”
Close with a decision register
Capture:
- KPI
- Issue
- Decision
- Owner
- Due date
- Expected effect
- Next review
Read Project Management Training for Accountants for connecting measures to owners, deadlines, dependencies, and follow-through.
Choose Industry-Specific KPIs
Industry specialization makes KPI advisory more useful because similar businesses often share similar operating drivers.
Professional services
Possible KPIs:
- Backlog
- Revenue per professional
- Utilization
- Realization
- Project margin
- Client concentration
- Days to invoice
- DSO
Recurring service businesses
Possible KPIs:
- Recurring revenue
- Customer retention
- New recurring revenue
- Gross margin
- Service capacity
- Response time
- Customer acquisition cost
Construction and project businesses
Possible KPIs:
- Backlog
- Gross profit fade/gain
- Schedule variance
- Change-order capture
- Labor productivity
- Cash conversion
- Under/overbilling where applicable
Distribution
Possible KPIs:
- Gross margin by product
- Inventory turns
- Stockout rate
- Order fill rate
- DSO
- Customer concentration
- Warehouse productivity
Health-care practices
Possible KPIs:
- Patient volume
- Revenue per visit
- Provider capacity
- Collection rate
- Days in receivables
- No-show rate
- Payer mix
Retail and hospitality
Possible KPIs:
- Same-location sales
- Average ticket
- Transactions
- Labor percentage
- Gross margin
- Inventory shrink
- Table or room utilization where relevant
Do not copy industry KPI lists without defining the business model
Two businesses in the same industry may have different:
- Strategy
- Pricing
- Customer mix
- Capacity constraints
- Growth stage
CPA.com’s current verticalization guidance emphasizes the value of deeper industry knowledge in delivering more specialized advisory services.
Avoid Metric Gaming and Unintended Behavior
People respond to what is measured
A poorly designed KPI can improve the number and damage the business.
Examples
| KPI | Possible Unintended Behavior | Balancing Measure |
|---|---|---|
| Revenue growth | Discounting or accepting low-quality customers | Margin, retention, cash collection |
| Utilization | Avoiding training or automation | Quality, cycle time, client outcome |
| Calls handled | Rushing customers | Resolution and satisfaction |
| Inventory reduction | Stockouts | Fill rate and lost sales |
| DSO | Rejecting good customers with strategically appropriate terms | Margin, risk, customer value |
Use counter-metrics
When a KPI creates a strong incentive, identify what management does not want sacrificed.
Do not turn advisory KPIs into employee surveillance without appropriate governance
Employee measures may affect:
- Performance management
- Compensation
- Privacy
- Employment decisions
Those uses require appropriate policies and qualified guidance.
Scope KPI Advisory, Data Responsibilities, and Professional Boundaries
AICPA professional standards include consulting-services standards that may apply to management and financial consulting work. Firms should determine which standards apply to the actual service performed. Source: AICPA Standards and Statements.
Define the service objective
Example:
“Design and maintain a management KPI framework for the client’s service operations and facilitate monthly performance discussions focused on growth, margin, capacity, customer retention, and working capital.”
Define deliverables
Possible deliverables:
- Critical-success-factor map
- KPI driver tree
- KPI definition cards
- Dashboard
- Monthly trend package
- Benchmark analysis
- Management meeting
- Decision and action register
Define client responsibilities
Management should own:
- Strategy and goals
- Operational definitions
- Source-system accuracy
- Targets
- Operating decisions
- Implementation
- Employee actions
Define data boundaries
KPI systems may pull from:
- General ledger
- Payroll
- CRM
- POS
- Inventory
- Practice management
- Time tracking
- Customer-support systems
Document access, confidentiality, security, retention, and reconciliation responsibilities.
Recognize scope changes
Creating a dashboard may lead to requests for:
- Pricing strategy
- Compensation redesign
- Sales-process consulting
- Operational implementation
- Benchmarking research
- System integration
These may require new scope, fees, specialists, or professional safeguards.
Read Scope Creep in Accounting Firms for controlling added work before production begins.
Technology, Automation, and AI in KPI Advisory
Technology should reduce data preparation—not replace metric judgment
Modern BI and dashboard tools can connect accounting, payroll, CRM, inventory, and operational data.
CPA.com resources on CAS analytics describe BI and data analytics as tools that help advisors gain insight and foresight rather than spend most of their time manually calculating ratios and building spreadsheets.
Source: Taking Your Client Advisory Services to the Next Level with BI and Data Analytic Tools.
Automate data collection where possible
Automation can support:
- Scheduled data extraction
- Metric calculation
- Threshold alerts
- Segment reporting
- Trend updates
- Dashboard refresh
- Meeting preparation
Do not automate undefined KPIs
An automated bad definition produces consistent bad information.
Before automation, confirm:
- Formula
- Population
- Source
- Frequency
- Owner
- Target
- Action rule
AI can assist KPI advisory
AI may help:
- Suggest possible metrics from a business model
- Draft driver trees
- Detect unusual trends
- Summarize dashboard movement
- Generate diagnostic questions
- Compare segments
- Draft meeting agendas
AI must not decide which metric is “key” without human validation
The accountant and client must verify:
- Business strategy
- Operational meaning
- Data reliability
- Relationship to the decision
- Unintended incentives
- Professional boundaries
Interactive dashboards can improve the meeting
Current Journal of Accountancy guidance notes that interactive dashboards can allow real-time exploration of follow-up questions by categories such as product, region, or department.
That capability is useful only when the client knows which question matters.
Worked Example: Which KPI Should Drive the Hiring Decision?
Illustrative example only: The figures below demonstrate the KPI-selection method. They are not industry benchmarks or recommendations for a specific client.
A multi-location home-services company is considering hiring another service manager.
The owner initially asks the accountant to track:
- Total revenue
- Headcount
- Revenue per employee
Those metrics do not fully answer the hiring question.
Step 1: Define the decision
Should management hire another service manager this quarter?
Step 2: Define the desired outcome
Support profitable growth without increasing customer wait time, technician downtime, or management overload.
Step 3: Define critical success factors
- Enough demand
- Enough technician capacity
- Management span becoming constrained
- Contribution margin sufficient to fund the role
- Cash sufficient for the ramp period
Step 4: Choose KPIs
| KPI | Why It Matters | Type |
|---|---|---|
| Booked service backlog | Shows sustained demand pressure | Leading |
| Average customer wait time | Shows whether capacity is harming service | Leading / customer |
| Technician productive capacity | Shows whether technician labor is actually constrained | Operational |
| Contribution margin by location | Shows whether growth can economically support another manager | Lagging / financial |
| Manager span and unresolved escalations | Shows management-capacity pressure | Leading / operational |
| 13-week minimum cash | Shows whether the hiring ramp fits liquidity | Financial / forward-looking |
Step 5: Define thresholds
Management and the accountant agree to investigate hiring when:
- Backlog remains above the agreed level for four weeks
- Customer wait time exceeds the service standard
- Existing managers consistently exceed the agreed span or escalation load
- Location contribution remains above the minimum required to support the role
- The cash forecast stays above the minimum threshold after adding payroll
Step 6: Segment the analysis
Companywide averages hide the issue.
Location A has excess capacity.
Location B is the constraint.
One Revenue Metric Cannot Answer a Capacity Decision
Illustrative relative bars only. The example demonstrates decision architecture, not benchmark levels.
The advisory conclusion
The accountant does not say:
“Revenue is up 14 percent, so hire.”
The accountant says:
“The hiring signal is concentrated in Location B. Backlog and wait time have remained above the agreed thresholds, manager escalation volume is elevated, contribution supports the role, and the modeled cash position remains above the minimum. Management now has evidence to evaluate the hire rather than relying on total revenue growth.”
The KPI system improved the decision because it connected:
The KPI Advisory Dashboard
Primary decision KPIs
Limit the executive view to the measures required for the current strategy and decisions.
For each one, show:
- Current result
- Target
- Threshold
- Trend
- Variance
- Status
- Owner
Driver metrics
Show the operational measures that explain the KPI.
Example:
Primary KPI: gross margin.
Drivers:
- Price realization
- Labor hours
- Overtime
- Material cost
- Product or service mix
- Rework
Decision queue
A decision dashboard should explicitly show:
- Decision required
- Decision owner
- Date required
- KPI evidence
- Options being considered
Action register
Track:
- Action
- Owner
- Due date
- Expected KPI effect
- Actual effect
- Next review
KPI quality
Track whether the measure itself remains useful:
- Data completeness
- Data timeliness
- Formula changes
- Threshold relevance
- Decision usage
- Metric retirement
Do not let dashboard administration consume advisory capacity
Standardize recurring calculations and automate routine updates so manager time is used for interpretation and client decisions.
A 90-Day KPI Advisory Implementation Plan
Days 1–30: Define the service and build the KPI architecture
- Select target client profiles and industries
- Define the KPI advisory objective
- Identify common management decisions
- Build critical-success-factor maps
- Create driver-tree templates
- Create KPI definition cards
- Define data requirements and owners
- Draft engagement scope and limitations
- Establish manager review and approval
Deliverable: A repeatable KPI advisory methodology rather than a dashboard catalog.
Days 31–60: Train through scenarios
- Distinguish metrics from KPIs
- Practice decision-first metric selection
- Build leading and lagging pairs
- Choose financial and nonfinancial measures
- Define formulas and populations
- Set targets and thresholds
- Segment data
- Identify unintended incentives
- Lead KPI conversations
Deliverable: Accountants who can explain why each KPI exists and what decision it supports.
Days 61–90: Pilot with selected clients
- Select clients with reliable data and clear decisions
- Conduct strategy and critical-success-factor discovery
- Build a limited KPI set
- Validate definitions and sources
- Run the first advisory meeting
- Capture actions and decisions
- Measure usage and outcomes
- Retire or revise weak metrics
Deliverable: Evidence that the KPI system changes management discussions and can be delivered consistently.
Do not start with the software
Define the decision architecture first.
Then choose the technology capable of supporting it.
The Complete 30-Day KPI Advisory Training Plan
Days 1–5: KPI foundations
- Distinguish metrics, KPIs, dashboards, benchmarks, and targets
- Define critical success factors
- Identify management decisions
- Study leading and lagging indicators
- Study financial and nonfinancial measures
- Practice eliminating vanity metrics
Evidence: Definitions assessment and decision-to-KPI mapping exercise.
Days 6–10: Driver trees and KPI design
- Build revenue, margin, cash, customer, and capacity driver trees
- Identify operational levers
- Create KPI definition cards
- Define formula, population, source, frequency, and owner
- Test data reliability
- Identify counter-metrics
Evidence: Complete driver tree and KPI dictionary.
Days 11–15: Targets, benchmarks, and segmentation
- Set targets and thresholds
- Compare historical, budget, forecast, and benchmark reference points
- Segment by customer, service, location, product, and cohort
- Identify averages that hide risk
- Test industry relevance
- Review unintended incentives
Evidence: KPI target matrix and segmented analysis.
Days 16–20: Dashboard and meeting
- Design an executive KPI view
- Create diagnostic drill-downs
- Use exception-based reporting
- Write dashboard narratives
- Lead the five-question KPI discussion
- Create a decision and action register
Evidence: Dashboard and recorded advisory meeting simulation. Read Feedback Training for Accounting Managers for coaching staff through analytical and client-communication corrections without recreating the work.
Days 21–25: Industry, technology, and boundaries
- Choose industry-specific KPIs
- Review data integration
- Validate AI-generated metric suggestions
- Control employee and sensitive data
- Recognize scope expansion
- Keep management responsible for decisions
Evidence: Industry KPI package and professional-boundary case.
Days 26–30: Independent capstone
- Analyze an unfamiliar client
- Define the management decision
- Build critical success factors
- Choose a limited KPI set
- Defend every metric
- Design the dashboard
- Lead the client meeting
- Recommend which metrics to retire
Evidence: Complete DECIDE advisory package and 100-point scorecard.
Use Scenario-Based Training for Accountants so staff practice metric judgment, business translation, and client conversations before live management decisions depend on them.
The 30/60/90-Day Live-Work Progression
Days 31–60: Controlled KPI analysis responsibility
The learner may:
- Prepare KPI calculations
- Validate formulas and data sources
- Build driver trees
- Prepare trend and segment analysis
- Draft dashboard commentary
- Identify threshold breaches
- Prepare client questions
Experienced managers retain final responsibility for service scope, metric architecture, material client recommendations, sensitive employee measures, significant benchmark interpretation, and professional-risk decisions.
Days 61–90: Scoped advisory responsibility
Expand responsibility when the learner consistently:
- Starts with the client decision
- Chooses limited, relevant KPIs
- Separates leading and lagging indicators
- Uses reliable definitions and data
- Segments appropriately
- Explains causes rather than merely variances
- Frames options and actions clearly
- Recognizes when a KPI should be retired
After day 90: Authority remains defined
Firm leadership may retain authority for:
- Engagement acceptance and pricing
- Material strategy recommendations
- Compensation or employee-performance metrics
- Regulated or specialized benchmarks
- Attest-client independence decisions
- System implementation and data-governance decisions
100-Point KPI Advisory Readiness Scorecard
| Capability | Points | Observable Evidence |
|---|---|---|
| Decision and outcome definition | 12 | Begins with a clear client decision, strategic outcome, or risk rather than a generic KPI list |
| Critical success factors | 10 | Identifies the small number of conditions that must go well for the outcome |
| KPI selection | 14 | Chooses material leading, lagging, financial, and nonfinancial measures with clear decision relevance |
| Driver-tree reasoning | 10 | Connects operating drivers to financial outcomes without assuming causation blindly |
| Definition and data integrity | 12 | Defines formula, population, source, owner, frequency, and validation |
| Targets, thresholds, and benchmarks | 10 | Uses appropriate reference points and distinguishes target from action threshold |
| Segmentation and interpretation | 8 | Finds customer, product, service, location, cohort, or employee-group patterns hidden in totals |
| Dashboard and communication | 10 | Creates an exception-focused view and translates movement into business language |
| Action and behavior design | 8 | Defines decisions, owners, due dates, and balancing measures that reduce gaming |
| Scope and professional safeguards | 6 | Recognizes data, employee, independence, benchmark, implementation, and scope boundaries |
Suggested readiness rule: Require at least 84 points overall, no zero category, no KPI without a documented definition and decision purpose, no material client recommendation based on unreliable data, and leadership review for sensitive, strategic, regulated, or expanded-scope matters.
Realistic KPI Advisory Training Scenarios
Scenario 1: The 26-metric dashboard
The client tracks many ratios but cannot identify which measures should drive the next hiring decision. The learner must reduce the dashboard to a decision architecture.
Scenario 2: Revenue growth with falling margin
Sales are up 20 percent, but contribution margin is declining. The learner must identify price, mix, labor, and delivery drivers before celebrating growth.
Scenario 3: Website traffic as a vanity metric
Traffic rises sharply while qualified leads and profitable customer acquisition remain flat.
Scenario 4: The companywide average
Total gross margin appears stable, but one location is deteriorating rapidly.
Scenario 5: The DSO target
Management pushes collections aggressively to reduce DSO, but the company risks damaging strategically important customers with appropriately negotiated terms.
Scenario 6: Utilization improves while quality declines
A professional-services firm rewards utilization and begins seeing more rework, missed training, and delayed automation.
Scenario 7: The retention metric
The client cannot agree whether one-time customers, paused accounts, and contract downgrades count as churn.
Scenario 8: The benchmark trap
An industry average suggests labor cost is too high, but the client intentionally operates a premium high-service model.
Scenario 9: The delayed indicator
Quarterly customer churn is discovered after the underlying service problems have existed for months.
Scenario 10: The wrong denominator
Two managers calculate revenue per employee differently because one includes owners and contractors and the other does not.
Scenario 11: The AI-recommended KPI set
AI suggests 18 generic metrics for a niche distribution company without understanding its consignment inventory model.
Scenario 12: The employee-scorecard risk
A client wants to use individual productivity KPIs for compensation decisions. The learner must identify data, fairness, policy, and employment-governance boundaries.
Scenario 13: Cash improves while the business weakens
Cash rises because the client stops buying inventory, but fill rates and future sales are falling.
Scenario 14: The dashboard nobody uses
The firm spends hours producing a dashboard, but the client never discusses or acts on the measures.
Scenario 15: The KPI retirement decision
A metric was useful during a turnaround but is no longer linked to a current strategic decision.
Each scenario should require the learner to define the decision, identify critical success factors, choose and defend KPIs, validate data, interpret trade-offs, and propose an action or retirement decision.
What the Firm Should Measure About Its KPI Advisory Service
| Metric | What It Reveals |
|---|---|
| KPIs per executive dashboard | Whether the service is focused or overloaded |
| KPI definition completeness | Whether formula, population, source, owner, target, and action are documented |
| Data exception rate | Reliability of source systems and recurring calculations |
| Threshold-triggered decisions | Whether KPIs are actually used in management action |
| Decision-to-action completion | Whether meetings create operating follow-through |
| Metric retirement rate | Whether the KPI system evolves instead of accumulating permanently |
| Forecast or target variance explained | Quality of interpretation rather than number production |
| Client meeting decisions | Whether advisory conversations are decision oriented |
| Manager review hours | Whether staff can perform KPI analysis with growing independence |
| Repeated analytical corrections | Whether KPI judgment and data skills are transferring |
| Advisory realization / margin | Whether the service is economically sustainable |
| Client retention / expansion | Whether clients perceive continuing strategic value |
Read Client Profitability Analysis for Accounting Firms for evaluating whether recurring advisory work creates sustainable contribution after delivery and review capacity.
Common KPI Advisory Mistakes
Mistake 1: Starting with available data
The dashboard reflects what is easy to pull rather than what management needs to decide.
Mistake 2: Calling every metric a KPI
Management attention becomes fragmented.
Mistake 3: Tracking only lagging financial results
The client learns about problems after operating decisions have already occurred.
Mistake 4: Tracking only leading activity
Busy activity is mistaken for successful outcomes.
Mistake 5: Using undefined formulas
Meetings become arguments about denominators and source systems.
Mistake 6: Using benchmarks without business-model context
A client is pushed toward an industry average that does not fit its strategy.
Mistake 7: Hiding segment problems inside averages
One location, customer cohort, product, or service line deteriorates while the total looks acceptable.
Mistake 8: Using red-yellow-green without action rules
The dashboard signals urgency but nobody knows what to do.
Mistake 9: Ignoring unintended incentives
Employees optimize the number rather than the business outcome.
Mistake 10: Building the dashboard before the KPI definition
Visual polish hides inconsistent data.
Mistake 11: Reading the dashboard during the advisory meeting
The accountant adds no interpretation beyond what the client can already see.
Mistake 12: Never retiring metrics
The dashboard grows until key information becomes hard to find.
Mistake 13: Using AI-generated KPIs without business validation
Generic metrics are applied to a client with different strategy, economics, or operating model.
Mistake 14: Giving KPI advisory away inside monthly reporting
The firm performs strategy, segmentation, modeling, and management analysis without defined scope or fee.
Mistake 15: Confusing correlation with cause
A metric moves with an outcome, and management assumes changing the metric will necessarily change the result.
Frequently Asked Questions About KPI Advisory Training for Accountants
What is KPI advisory training for accountants?
It teaches accountants to connect client strategy and critical success factors to a limited set of reliable financial and nonfinancial measures, define targets and thresholds, interpret results, and use those measures in recurring management decisions.
What is the difference between a metric and a KPI?
A metric is anything measurable. A KPI is a metric that is material to a critical business outcome and used to monitor or support an important management decision.
How many KPIs should a client track?
There is no universal number, but the executive view should normally remain small enough that management can identify what matters quickly. Additional diagnostic metrics can sit below the primary KPI layer.
What makes a good KPI?
A good KPI is relevant to an important outcome, reliable, understandable, timely, sufficiently controllable or actionable, consistently defined, and paired with a target or threshold that affects a decision.
What is a leading KPI?
A leading KPI measures an operating condition or driver that may provide earlier information about a future outcome, such as backlog, response time, qualified pipeline, or past-due receivables.
What is a lagging KPI?
A lagging KPI measures a result after activity has occurred, such as revenue, gross margin, cash flow, customer churn, or net profit.
Should accountants use nonfinancial KPIs?
Yes, when nonfinancial drivers such as customer retention, quality, wait time, capacity, conversion, rework, or employee turnover materially influence financial outcomes and management decisions.
How should KPIs be selected?
Start with the client decision or desired outcome, identify critical success factors, build a driver tree, choose leading and lagging measures, validate data, and define targets, thresholds, ownership, and actions.
What is a KPI definition card?
It is a concise record of a KPI’s purpose, formula, population, source, owner, frequency, target, threshold, and the management action it supports.
How should KPI targets be set?
Targets can use management goals, budgets, forecasts, historical performance, internal best performance, industry benchmarks, or contractual requirements. The reference point should fit the client’s strategy and facts.
What is the difference between a target and a threshold?
A target is the desired result. A threshold is the point at which management should investigate, decide, or act.
Should a KPI dashboard show every metric?
No. The executive dashboard should emphasize the small set of primary KPIs and exceptions. Supporting detail and diagnostics can be available through drill-downs.
How should accountants use industry benchmarks?
Use them as context rather than automatic targets. Confirm differences in company size, pricing, customer mix, geography, accounting definitions, growth stage, and operating model.
Can KPIs create bad behavior?
Yes. Metrics influence attention and incentives. Pair important KPIs with balancing measures and monitor whether people improve the underlying business outcome rather than merely the number.
How can AI help with KPI advisory?
AI can suggest metrics, draft driver trees, identify trends, summarize variance, and generate questions, but people must validate strategy, data, definitions, decision relevance, confidentiality, and unintended incentives.
How often should KPIs be reviewed?
The operating cadence depends on the decision. Some KPIs may require daily or weekly monitoring; others are appropriate monthly or quarterly. The KPI set itself should also be reviewed periodically and changed as strategy changes.
How should KPI advisory be scoped?
Define the objectives, critical-success-factor work, KPI definitions, source systems, dashboard, review cadence, client and accountant responsibilities, benchmarks, meetings, fees, and scope-change process.
How do CPA firms train accountants to provide KPI advisory?
Combine financial-analysis foundations with decision-first metric selection, driver trees, nonfinancial measures, segmentation, benchmark interpretation, dashboard design, client-meeting simulations, and controlled live-work practice.
Can Your Staff Turn a Dashboard Into a Client Decision—or Do They Stop at the Ratio?
SkillAbility helps accounting firms develop technical execution, advisory judgment, client communication, manager capability, and leadership readiness through structured practice, scenarios, feedback, and measurable development pathways.
Book Your Free 10-Minute Structural Alignment Review →
Includes our 45-Day Out-of-Pocket Performance Guarantee.
To measuring what changes the decision—not everything that can be measured,
Vincent Howard, CPA
Managing Partner, Howard, Howard and Hodges
SkillAbility for Accounting Firms
About the Author
Vincent Howard, CPA has practiced public accounting since 1990. He earned a Bachelor of Science in Accounting and a Master’s in Taxation from the University of Central Florida, founded his accounting firm in 1993, and serves as Managing Partner of Howard, Howard and Hodges. He helped grow the organization from three people to approximately 50 staff across multiple Florida locations and states. He has participated in PASBA since 1997, and the firm was named PASBA Firm of the Year in 2015. Since 2020, he has built and run the SkillAbility accounting workforce development platform, used by more than 1,000 accounting professionals across dozens of PASBA firms.
© 2026 SkillAbility for Accounting Firms. This article provides general educational information and does not replace accounting, tax, audit, legal, ethics, independence, consulting, employment, compensation, data-security, industry-regulatory, professional-liability, or other qualified advice. KPI definitions, benchmarks, targets, recommendations, and dashboards should be tailored to the client’s business model, strategy, data, engagement scope, professional obligations, and applicable law.