
By Vincent Howard, CPA | Managing Partner, Howard, Howard and Hodges | SkillAbility for Accounting Firms
Last updated: August 14, 2026 | 53-minute read
- What restaurant accounting training means
- Why restaurant economics demand specialized fluency
- The MARGIN framework
- Map the restaurant concept and sales channels
- Reconcile POS sales to cash and the general ledger
- Food cost, COGS, and inventory
- Actual versus theoretical food cost
- Inventory, purchasing, receiving, and waste controls
- Labor cost, scheduling, and productivity
- Tips, service charges, payroll, and 2026 tax awareness
- Prime cost and margin interpretation
- Menu engineering and contribution
- Delivery, catering, gift cards, and channel economics
- Unit and multi-location profitability
- Restaurant cash flow and working capital
- Tax, sales-tax, and entity awareness
- Restaurant KPIs that change decisions
- Run the monthly restaurant economics review
- Build recurring restaurant advisory
- AI and restaurant accounting
- Worked restaurant economics example
- 90-day firm implementation plan
- 30-day staff training curriculum
- 30/60/90 live-work progression
- 100-point readiness scorecard
- 15 realistic restaurant scenarios
- What the CPA firm should measure
- Common restaurant-training mistakes
- Frequently asked questions
A restaurant owner says sales are up 8% but cash is worse than last year.
A generalist accountant sees higher payroll and food purchases.
A restaurant-fluent accountant asks:
- Did guest traffic rise—or only menu prices?
- Did sales mix shift toward lower-contribution items?
- Did food cost rise because vendor prices changed, inventory was miscounted, portions drifted, or waste increased?
- Did scheduled labor grow faster than transactions?
- Did overtime or management coverage increase?
- Did third-party delivery become a larger share of revenue?
- Are card settlements, tips payable, sales tax, or gift-card liabilities distorting the cash view?
- Did the owner fund equipment or distributions while vendor terms tightened?
Restaurant accounting becomes advisory-ready when staff can trace one sales dollar through discounts, food, labor, channel fees, overhead, working capital, and cash.
Who I Am and Why This Matters
I have practiced public accounting since 1990. I founded my accounting firm in 1993, merged it in 2001 to form Howard, Howard and Hodges, and helped grow the organization from three people to approximately 50 staff across multiple Florida locations and states. Our firm was named PASBA Firm of the Year in 2015.
Restaurants are a good example of why industry fluency matters. The P&L can tell you food cost increased. It cannot, by itself, tell you whether the cause was commodity inflation, purchasing, portions, waste, theft, inventory counting, menu mix, or a pricing decision. It can tell you labor rose. It cannot tell you whether the practice overstaffed slow dayparts, paid more overtime, added profitable capacity, or simply failed to convert scheduled hours into sales.
Since 2020, I have built and run the SkillAbility accounting workforce development platform, used by more than 1,000 accounting professionals across dozens of PASBA firms.
The development opportunity is to give staff a repeatable operating model so they can interpret restaurant financials rather than simply assemble them.
Read Industry Specialization Training for Accountants for the broader niche-development model and Knowledge Transfer System for CPA Firms for transferring industry knowledge beyond one partner.
What Is Restaurant Accounting Training for Accountants?
Restaurant accounting training develops an accountant’s ability to understand how sales move through POS systems and sales channels, how inventory becomes food and beverage cost, how staffing becomes labor cost, how menu and channel mix affect contribution, how taxes and tips move through payroll and liabilities, and how those operating drivers ultimately determine restaurant cash flow and profitability.
Restaurant accounting is an operating discipline
Staff should be able to explain:
- Why sales and bank deposits differ
- Why food purchases and food cost differ
- Why labor percentage can rise even when wages are controlled
- Why a high-margin item can still be operationally unattractive
- Why delivery growth can increase sales but compress contribution
- Why reported profit can coexist with a cash shortage
The accountant should see the restaurant as a flow of units
Those units include:
- Guests
- Checks / transactions
- Menu items
- Ingredient quantities
- Labor hours
- Seats / tables / service periods
- Inventory units
- Delivery orders
- Cash settlements
CPA staff do not need to become operators
The objective is not to tell chefs how to cook, managers how to schedule every shift, or owners which concept to build. The objective is to understand the financial consequences well enough to ask better questions, identify leakage, build scenarios, and know when the client needs a restaurant-operations, payroll, legal, tax, or technology specialist.
Why Restaurant Economics Demand Specialized Fluency
The margin for error is unusually small
The National Restaurant Association’s 2025 Restaurant Operations Data Abstract, based on more than 900 restaurants, reported median 2024 income before taxes of 2.8% of sales for fullservice respondents and 4.0% for limited-service respondents.
Source: National Restaurant Association — Restaurant Performance.
Food and labor dominate the cost structure
The same 2025 operations data reported median food and non-alcohol beverage costs of 32.0% of sales for fullservice restaurants and 32.4% for limited-service restaurants. Labor including salaries, wages, and benefits represented a median 36.5% of sales for fullservice respondents and 31.7% for limited-service respondents.
Sources: National Restaurant Association — Food Costs and National Restaurant Association — Labor Costs.
Current 2026 conditions remain challenging
In July 2026, the Association reported that food and labor each still accounted for roughly 33 cents of every restaurant sales dollar. Average restaurant hourly earnings were 41% above February 2020 levels, wholesale food prices were 35% higher, and 33% of operators said their restaurant was not profitable during the first half of 2026.
Source: National Restaurant Association — July 2026 Business Conditions.
Rising sales do not automatically solve cost inflation
A separate July 2026 National Restaurant Association analysis estimated total expenses for an average restaurant were 36% higher in 2026 than in 2019. It also noted that menu prices had increased roughly 36% from February 2020 to May 2026, illustrating how much of recent sales growth has been required simply to absorb higher operating costs.
Source: National Restaurant Association — Elevated Costs and Profitability.
Median Cost Ratios Leave Little Room for Error
| Metric | Fullservice | Limited Service |
|---|---|---|
| Food / non-alcohol beverage cost | 32.0% | 32.4% |
| Labor incl. benefits | 36.5% | 31.7% |
| Occupancy | 5.7% | 5.2% |
| Income before taxes | 2.8% | 4.0% |
Source: National Restaurant Association 2025 Restaurant Operations Data Abstract commentary. These are respondent medians, not universal standards or recommended targets. The Association explicitly cautions against treating them as goals for individual restaurants.
Profitability differences are visible inside labor cost
Among fullservice respondents that reported a pre-tax profit in 2024, median labor cost was 34.2% of sales. Among those reporting a loss, the median was 42.9%. In limited service, the corresponding medians were 30.0% for profitable respondents and 34.1% for loss-making respondents.
Source: National Restaurant Association — Labor Cost and Profitability.
2024 Fullservice Respondents
Source: National Restaurant Association 2025 Operations Data Abstract commentary. Association data is intended as a management comparison tool, not a target.
The MARGIN Framework for Restaurant Accounting Training
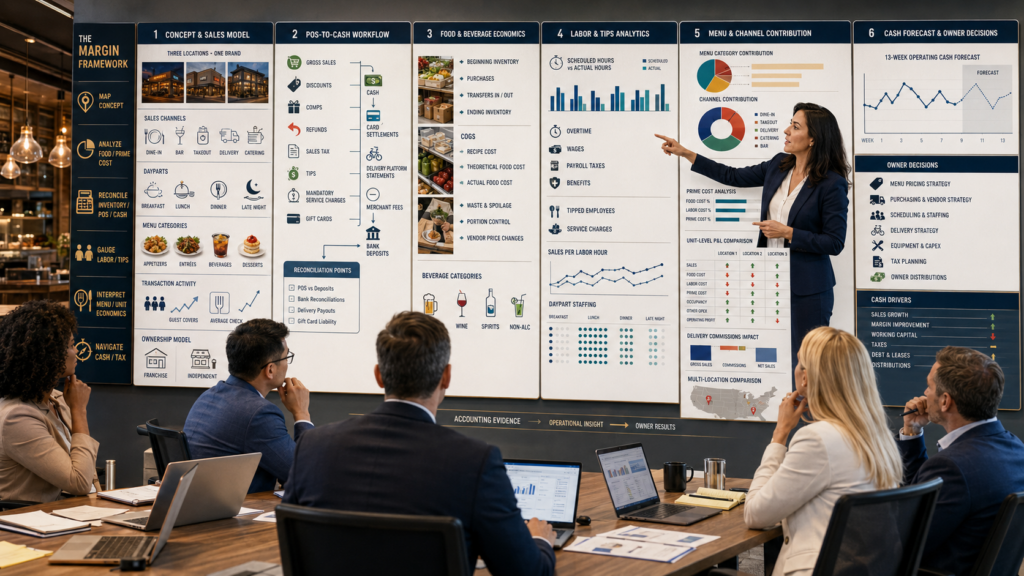
M-A-R-G-I-N
M — Map the Concept and Sales Channels
Understand service model, locations, hours, revenue channels, dayparts, menu categories, franchise structure, and owner goals.
A — Analyze Food, Beverage, and Prime Cost
Build COGS, food cost, beverage cost, recipe cost, prime cost, and cost-variance fluency.
R — Reconcile Inventory, POS, and Cash
Connect POS sales, discounts, taxes, tips, gift cards, delivery settlements, inventory, bank deposits, and the general ledger.
G — Gauge Labor, Tips, and Productivity
Understand scheduled versus actual labor, overtime, tipped payroll, service charges, sales per labor hour, and staffing by daypart.
I — Interpret Menu, Channel, and Unit Economics
Analyze item contribution, menu mix, third-party delivery, catering, unit profitability, and multi-location differences.
N — Navigate Cash, Tax, and Next Decisions
Forecast cash, monitor tax and tip liabilities, plan capex and debt, and turn restaurant metrics into operating actions.
Map the Restaurant Concept and Sales Channels
Start with how the restaurant actually operates
Capture:
- Full service, limited service, fast casual, bar, catering, ghost kitchen, franchise, food truck, or hybrid model
- Number of units
- Seats / capacity
- Operating days and dayparts
- Dine-in, takeout, delivery, catering, retail, and events
- Alcohol mix
- Franchise royalties and advertising fund obligations
- POS, payroll, inventory, scheduling, delivery, merchant-processing, and accounting systems
- Owner compensation and distribution expectations
Map the sales dollar before looking at the P&L
A $100 guest check can contain multiple financial components:
- Food sales
- Alcohol sales
- Discounts
- Sales tax
- Voluntary tip
- Mandatory service charge
- Gift-card redemption
- Delivery fee
Not all of those amounts are restaurant revenue, and not all settle to the bank on the same timetable.
Separate revenue channels
At minimum, management reporting should distinguish:
- Dine-in
- Direct takeout / pickup
- First-party delivery
- Third-party delivery
- Catering
- Events
- Gift-card sales and redemptions
- Retail / merchandise where material
One concept can contain multiple business models
A dining-room transaction may carry high labor and occupancy intensity. A catering order may create large revenue with different staffing and purchasing patterns. Third-party delivery may add incremental demand but include commissions, promotional charges, and different packaging costs.
That is why a single “restaurant revenue” line is often insufficient for advisory work.
Reconcile POS Sales to Cash and the General Ledger
The POS is an operating subledger
The daily sales report should normally help explain:
- Gross sales
- Discounts
- Comps
- Voids
- Refunds
- Taxes
- Tips
- Service charges
- Gift-card activity
- Cash receipts
- Card receipts
- Delivery-platform receipts
Build a daily sales bridge
The exact bridge depends on how the POS reports gross sales and how the accounting framework treats each item.
Then reconcile settlement—not just sales
Some processors deposit net of fees; others bill fees separately. The accountant should understand the actual settlement report rather than force a generic journal entry.
Third-party delivery needs its own reconciliation
A platform settlement may include:
- Gross menu sales
- Restaurant-funded promotions
- Platform commissions
- Delivery fees
- Taxes collected / remitted depending on jurisdiction and marketplace rules
- Refunds
- Tips
- Net cash deposited
Do not book the bank deposit as restaurant revenue
Netting platform fees or merchant fees directly against deposits can hide channel economics and make revenue comparisons unreliable.
Use daily or weekly exception reporting
Useful exceptions include:
- Unreconciled merchant deposits
- Cash over / short
- High voids or comps
- Unusual refunds
- Delivery settlements missing
- Gift-card liability mismatch
- Sales-tax mismatch
Food Cost, COGS, and Inventory
Food purchases are not food cost
The concept is simple. The accuracy depends on inventory counts, receiving, invoice coding, transfers, and cutoff.
Calculate food cost against the correct sales base
For a restaurant with material alcohol revenue, separate food, beer, wine, and liquor where operationally useful. Comparing total food-and-beverage COGS to only food sales can create a meaningless percentage.
2024 restaurant medians provide context
The National Restaurant Association reported median food and non-alcohol beverage cost of 32.0% of sales for fullservice respondents and 32.4% for limited-service respondents in 2024. These are management benchmarks, not universal targets.
Volume can affect food-cost ratios
Among fullservice respondents with annual sales of at least $2 million, median food and non-alcohol beverage cost was 31.0% of sales in 2024. For those below $2 million, the median was 33.7%. Median income before taxes was also higher in the larger-sales group, reinforcing that scale and purchasing efficiency can matter.
Source: National Restaurant Association — Restaurant Volume and Food Cost.
Do not diagnose a food-cost problem from one percentage
Potential causes include:
- Vendor-price changes
- Menu mix
- Recipe changes
- Portion drift
- Waste
- Spoilage
- Employee meals
- Comps
- Theft
- Inventory-count errors
- Invoice cutoff
- Transfers between locations
Actual Versus Theoretical Food Cost
Actual food cost tells you what the books consumed
Theoretical food cost estimates what should have been consumed
A theoretical model generally uses:
- Menu-item sales
- Standard recipes
- Standard ingredient quantities
- Current or standard ingredient costs
The variance is where operational questions begin
A positive unfavorable variance may point to:
- Overportioning
- Waste
- Spoilage
- Incorrect recipes
- Unrecorded employee meals
- Unrecorded comps
- Theft
- Receiving discrepancies
- Inventory errors
Theoretical cost is only as reliable as recipe and POS data
If recipe quantities are stale or modifiers are not captured correctly, theoretical food cost can create false precision.
Train staff to reconcile the model to physical reality
The accountant should ask:
- Were all count sheets complete?
- Were units of measure consistent?
- Were cases converted correctly?
- Were invoices entered in the correct period?
- Were transfers recorded?
- Were recipe costs updated for vendor pricing?
Inventory, Purchasing, Receiving, and Waste Controls
Inventory accuracy starts before the count
Build controls around:
- Approved vendors
- Purchase authorization
- Receiving documentation
- Quantity verification
- Price verification
- Invoice matching
- Storage access
- Transfers
- Waste logs
- Physical counts
Count cadence should follow risk and decision needs
Many operators benefit from frequent counts of high-value or high-variance items and a consistent full physical inventory cadence for financial reporting. There is no universal count frequency that fits every restaurant.
Standardize units of measure
A common source of errors is purchasing by case, storing by bottle, and costing by ounce while the inventory system treats all three as interchangeable.
Review inventory-turn signals carefully
A low turn may indicate excess inventory, slow-moving items, or purchasing issues. An extremely high turn may indicate understocking, count errors, or a concept that simply carries very little inventory. Context matters.
Separate waste from normal recipe usage
Waste should be visible enough to diagnose:
- Prep waste
- Expired product
- Kitchen errors
- Customer returns
- Spillage
- Breakage
Multi-unit restaurants need transfer discipline
Inventory moved between locations should not disappear from one unit and appear as unexplained favorable food cost in another.
Labor Cost, Scheduling, and Productivity
Restaurant labor should be measured as a fully loaded cost
Depending on the management purpose, include:
- Hourly wages
- Salaries
- Payroll taxes
- Benefits
- Overtime
- Bonuses
- Employer-paid payroll costs
The definition should be consistent before benchmarking.
Schedule versus actual labor is a control point
Track:
- Scheduled hours
- Actual hours
- Overtime
- Late clock-outs
- Call-outs
- Manager coverage
- Training shifts
Labor percentage can rise because sales fell
If labor dollars are flat but a storm reduces sales by 15%, labor percentage rises. That is different from a wage or scheduling problem.
Use productivity measures alongside percentages
Other useful measures can include:
- Transactions per labor hour
- Covers per labor hour
- Kitchen labor per food-sales dollar
- Front-of-house labor per sales dollar
- Management labor by unit
Daypart matters
A restaurant can hit a monthly labor target while consistently overstaffing weekday afternoons and understaffing weekend dinner.
Current benchmark context
For 2024, the National Restaurant Association reported median labor costs including benefits of 36.5% of sales for fullservice respondents and 31.7% for limited-service respondents. The Association cautions that its operating data is intended for comparison and diagnosis—not to establish a universal labor goal.
Labor should be connected to service
Cutting labor indiscriminately can cause:
- Long ticket times
- Lower table turns
- Poor guest experience
- More overtime later
- More food waste
- Manager burnout
Read Staff Leverage Ratio for Accounting Firms for the broader principle of matching work to the right level of labor rather than simply minimizing headcount.
Tips, Service Charges, Payroll, and 2026 Tax Awareness
Tax and employment-law boundary: Tip pooling, tip credits, service charges, wage rules, payroll treatment, and state requirements vary. The accountant should use current federal and state guidance and qualified payroll / legal review rather than relying on restaurant custom.
Tips and mandatory service charges are different for federal tax purposes
IRS guidance distinguishes voluntary tips from mandatory service charges. A mandatory service charge distributed to employees is generally treated as wages rather than tips.
Source: IRS — Tip Recordkeeping and Reporting.
Employees generally report cash tips to the employer
IRS Publication 15 for 2026 states that employees generally must report cash tips of $20 or more in a month to their employer, and those reported tips are generally subject to Social Security and Medicare tax and applicable withholding rules.
Source: IRS Publication 15 — Employer’s Tax Guide.
The 2025–2028 qualified-tip deduction does not eliminate payroll reporting
Current federal law allows eligible individuals a deduction of up to $25,000 of qualified tips for tax years 2025 through 2028, subject to income and other limitations. IRS guidance states that qualified tips are voluntary cash or charged tips, including tip-sharing amounts; mandatory service charges are not qualified tips. Tips generally remain subject to Social Security and Medicare tax.
Large food or beverage establishments may have Form 8027 obligations
IRS instructions require qualifying large food or beverage establishments to report receipts and tips annually on Form 8027 and address allocated tips when reported tips fall below the applicable allocation threshold.
Source: IRS — Instructions for Form 8027.
Restaurant employers may have a FICA tip credit
IRS Publication 334 describes the credit for employer Social Security and Medicare taxes paid on certain employee tips in food and beverage establishments where tipping is customary, generally claimed on Form 8846.
Source: IRS Publication 334 — Small Business Tax Guide.
Accounting training should reconcile tip flows
Staff should be able to trace:
- POS charged tips
- Cash tips where reported
- Tip pooling
- Tips payable
- Payroll distribution
- Employer payroll-tax treatment
- Service charges separately from tips
Prime Cost and Margin Interpretation
Prime cost combines the two largest operating cost families
The exact composition should be documented. Some restaurant reports include all beverage cost and full labor burden; others use narrower definitions.
Prime cost is powerful because small changes matter
The National Restaurant Association reported that food and labor each account for approximately 33 cents of every sales dollar in the current operating environment. In its 2025 Operations Data Abstract, prime costs including food, beverage, and labor represented a median 65 cents of every sales dollar in the limited-service segment.
Source: National Restaurant Association — 2025 Operations Data Abstract Release.
Do not manage prime cost as a single number only
A restaurant can hit prime cost while masking:
- Food cost favorable because menu prices rose
- Labor unfavorable because service intensity rose
- Beverage shrink offset by lower kitchen waste
- Understaffing that damages guest experience
Bridge prime-cost movement
Separate:
- Sales-volume effect
- Menu-price effect
- Menu-mix effect
- Ingredient-price effect
- Waste / portion variance
- Wage-rate effect
- Labor-hour effect
- Overtime effect
Use benchmarks diagnostically
The most useful question is not, “Are we at 65%?” It is, “Why did our prime cost move from our expected range, and what operating action explains the change?”
Menu Engineering and Contribution
Food-cost percentage is not enough to price a menu
Consider two items:
- Item A sells for $12 and costs $3.
- Item B sells for $30 and costs $12.
Item A has a lower food-cost percentage, but Item B contributes more dollars before labor and overhead.
Use both contribution dollars and popularity
A menu item can be:
- High contribution / high popularity
- High contribution / low popularity
- Low contribution / high popularity
- Low contribution / low popularity
Menu decisions affect operations
Before recommending a price or menu change, consider:
- Prep complexity
- Ticket time
- Labor intensity
- Waste
- Ingredient overlap
- Guest demand
- Brand positioning
Price increases can protect percentage margins while hurting traffic
The National Restaurant Association reported in July 2026 that much of recent nominal restaurant sales growth has been driven by higher menu prices while traffic remained uneven. That makes volume and transaction counts essential context when accountants interpret sales growth.
Train staff to separate price from volume
This is a management bridge, not a GAAP formula.
Read KPI Advisory Training for Accountants for selecting measures that change decisions rather than simply filling dashboards.
Delivery, Catering, Gift Cards, and Channel Economics
Third-party delivery should have channel-level economics
Measure:
- Gross sales
- Discounts / promotions
- Platform commissions
- Packaging
- Refunds
- Incremental labor
- Food cost
- Net contribution
Do not compare dine-in and delivery on gross sales alone
Delivery may use less dining-room labor but carry commissions and packaging. The answer depends on the concept and incremental capacity.
Catering can create attractive revenue with unusual working capital
Large events can involve:
- Deposits
- Advance purchasing
- Temporary labor
- Rentals
- Cancellation terms
- Final balances
Gift-card cash is not automatically current-period restaurant revenue
Gift-card sales generally create cash before redemption. The appropriate accounting depends on the applicable reporting framework and breakage policy. Staff should reconcile gift-card issuance, redemption, expiration / breakage where applicable, and outstanding liability.
Separate cash timing from contribution
A channel can be profitable over the full order lifecycle while temporarily consuming cash—or generate immediate cash while creating a future service obligation.
Unit and Multi-Location Profitability
One consolidated P&L can hide weak units
For multi-location operators, build unit-level visibility into:
- Net sales
- Transactions / covers
- Average check
- Food and beverage cost
- Labor
- Occupancy
- Delivery / merchant fees
- Controllable operating expenses
- Unit contribution
Separate controllable from allocated overhead
A restaurant manager may influence:
- Scheduling
- Waste
- Comps
- Local purchasing within policy
- Repairs
- Guest recovery
The manager may not control corporate accounting, owner salaries, central marketing, or acquisition debt.
Use same-store analysis
For established locations, compare:
- Sales
- Transactions
- Average check
- Labor hours
- Food cost
- Contribution
This separates growth from new units from performance at existing units.
Normalize new-unit ramp periods
A new restaurant may carry:
- Pre-opening payroll
- Training labor
- Opening inventory
- Grand-opening marketing
- Temporary inefficiency
The accountant should distinguish expected ramp costs from persistent operating problems.
Franchise concepts need another layer
Analyze royalties, required marketing fund contributions, technology charges, franchise fees, approved-vendor requirements, and other contractual costs separately from ordinary restaurant overhead.
Read Client Profitability Analysis for Accounting Firms for the broader logic of separating revenue volume from economic contribution.
Restaurant Cash Flow and Working Capital
Restaurant cash moves faster than many financial statements
Restaurants often collect quickly, but cash is also constantly moving through:
- Card settlements
- Cash drawers
- Payroll
- Tips payable
- Sales-tax liabilities
- Food vendors
- Alcohol distributors
- Rent
- Merchant fees
- Delivery platforms
- Debt service
- Equipment
Build a 13-week cash forecast
At minimum:
- Expected sales and settlements
- Payroll dates
- Vendor payment terms
- Rent
- Taxes
- Debt
- Franchise / royalty payments
- Capex
- Owner distributions
Do not forecast from revenue alone
Cash timing can differ because of:
- Merchant settlement delays
- Delivery-platform payment cycles
- Catering deposits
- Gift-card sales
- Vendor terms
- Payroll timing
- Tax due dates
Inventory is working capital
Buying inventory early may protect against price or supply risk but consumes cash. Excess inventory can also increase spoilage, theft, and counting complexity.
Growth can create a cash squeeze
A restaurant opening a second location may fund:
- Deposits
- Construction
- Equipment
- Pre-opening payroll
- Opening inventory
- Marketing
before the unit generates stable operating cash.
Read Cash Flow Advisory Training for Accountants and Financial Modeling Training for Accountants for moving from historical results to forward decisions.
Tax, Sales-Tax, and Entity Awareness
Restaurant accountants need tax-trigger awareness
Common areas include:
- Sales tax
- Payroll taxes
- Tip reporting
- Service charges
- FICA tip credit
- Depreciation and equipment
- Entity structure
- Owner compensation
- State and local filings
- Franchise taxes
Sales tax is jurisdiction-specific
Do not assume the POS tax configuration is correct merely because the system calculates something. Restaurants may have different treatment for:
- Dine-in
- Takeout
- Delivery
- Alcohol
- Catering
- Service charges
- Marketplace-facilitated sales
Actual taxability and sourcing depend on state and local law.
Reconcile tax collected to tax payable
Staff should understand:
- POS tax reports
- Marketplace taxes
- Tax included in gross sales
- Tax remitted by third parties where applicable
- Tax returns
- General-ledger liabilities
Tips and service charges require separate treatment
Current IRS guidance distinguishes voluntary tips from mandatory charges. Distributed mandatory service charges are generally wages rather than tips for federal payroll-tax purposes.
Equipment and leasehold improvements can create timing questions
Large purchases may involve depreciation, Section 179, bonus depreciation, financing, repairs-versus-capitalization, and placed-in-service analysis. Use current tax law and the client’s facts rather than making a purchase decision based on a deduction alone.
Read Strategic Tax Planning Training for Accountants for teaching staff to recognize planning triggers before year-end.
Restaurant KPIs That Actually Change Decisions
| Metric | What It Can Tell You | What It Can Hide |
|---|---|---|
| Net sales | Top-line performance | Traffic vs price vs mix |
| Transactions / covers | Guest volume | Average check and contribution |
| Food cost % | COGS intensity | Menu mix and theoretical variance |
| Actual vs theoretical food cost | Operational leakage | Bad recipes or bad count data |
| Labor % | Labor intensity | Sales-volume effect |
| Sales per labor hour | Labor productivity | Service quality |
| Prime cost | Combined food / labor pressure | Which component moved |
| Item contribution | Menu economics | Prep complexity and demand |
| Delivery contribution | Channel economics | Incremental capacity constraints |
| Cash coverage | Liquidity | Upcoming capex and tax obligations |
Use a KPI tree
Start with profit and cash, then trace backward:
One KPI should lead to one operating question
Examples:
- Food cost up: price, mix, waste, portions, or inventory?
- Labor up: wage rate, hours, overtime, or sales decline?
- Sales up: traffic, price, or mix?
- Cash down: settlement timing, vendors, tax, debt, capex, or distributions?
Read KPI Advisory Training for Accountants for building decision-oriented metrics.
Run the Monthly Restaurant Economics Review
1. Sales and traffic
Review:
- Net sales
- Transactions / covers
- Average check
- Daypart
- Channel mix
- Same-store trend
2. Food and beverage
Review:
- COGS
- Food cost %
- Beverage cost
- Actual vs theoretical variance
- Inventory trend
- Vendor-price changes
- Waste
3. Labor
Review:
- Scheduled vs actual hours
- Labor %
- Overtime
- Sales per labor hour
- Daypart staffing
4. Channel and menu economics
Review:
- Delivery contribution
- Catering
- Top / bottom menu-item contribution
- Discounts / promotions
- Merchant fees
5. Unit economics
Review:
- Occupancy
- Controllable expenses
- Unit contribution
- Multi-unit outliers
6. Cash
Review:
- 13-week forecast
- Tax liabilities
- Payroll
- Vendor commitments
- Debt
- Capex
- Owner distributions
Finish with decisions
Examples:
- Reprice selected menu items
- Correct portions or recipes
- Change vendor purchasing
- Adjust staffing by daypart
- Reduce a promotion
- Renegotiate delivery economics
- Delay capex
- Reduce owner distributions temporarily
Build Recurring Restaurant Advisory
A restaurant niche can be more valuable than monthly bookkeeping
A recurring service may include:
- POS-to-GL reconciliation
- Food / labor / prime-cost dashboard
- Inventory and variance analysis
- Unit-level P&Ls
- 13-week cash forecast
- Quarterly tax planning
- Monthly owner / operator review
Define the client’s data responsibilities
Require timely:
- POS reports
- Inventory counts
- Vendor invoices
- Payroll / scheduling reports
- Merchant settlements
- Delivery-platform statements
- Gift-card reports
- Bank / card statements
Price the service around interpretation and cadence
Standardization protects profitability
If every restaurant client sends different reports, uses different KPI definitions, and expects unlimited ad hoc analysis, the CPA firm can create a high-value service that is still economically unattractive to deliver.
Read Accounting Advisory Proposal Template for defining outcomes, scope, cadence, and client responsibilities.
AI and Restaurant Accounting
AI can accelerate high-volume restaurant analysis
Potential uses include:
- Classifying vendor invoices
- Summarizing food-cost variances
- Flagging unusual voids, comps, or refunds
- Comparing schedule and actual labor
- Drafting management questions
- Analyzing multi-unit trends
- Generating restaurant training scenarios
AI should not replace source reconciliation
Restaurant systems contain many overlapping data sources:
- POS
- Inventory platform
- Payroll
- Scheduling
- Merchant processing
- Delivery platforms
- Banking
- Accounting
An AI summary is useful only after the accountant knows which source controls each number.
Protect payment and employee data
Do not move card data, bank credentials, employee Social Security numbers, payroll records, or sensitive customer information into unapproved tools.
Use AI to create faster feedback loops
A manager could use AI-assisted variance analysis to identify:
- Food-cost spikes
- Overtime outliers
- Unit-level margin changes
- Delivery-fee increases
- Unexpected inventory movement
The accountant still validates the data and determines whether the signal is operational, accounting, tax, or simply bad source data.
Worked Example: Sales Are Up, but Restaurant Cash Is Down
Illustrative training example only: The figures below demonstrate restaurant diagnostic logic. They are not industry targets or recommendations for a specific restaurant.
A three-location fullservice restaurant group reports higher revenue but weaker cash and lower owner distributions.
Year-over-year operating facts
- Net sales: +8%
- Transactions / covers: -1%
- Average check: +9%
- Food cost: 31.8% → 34.1%
- Labor cost: 35.2% → 38.0%
- Third-party delivery sales: +35%
- Inventory dollars: +18%
- Accounts payable to food vendors: +22%
- Owner distributions: -20%
The inexperienced conclusion
“Food and payroll need to be cut.”
The restaurant-fluent accountant separates the drivers
Sales: Revenue growth came almost entirely from menu-price increases. Guest counts actually declined slightly.
Food: Chicken, dairy, and beef costs rose, but actual food cost increased more than the recipe-cost model predicted. Two units also showed growing actual-versus-theoretical variance.
Inventory: Managers increased purchasing to protect against price volatility. Inventory days rose, tying up cash and increasing spoilage risk.
Labor: Wage rates increased, but hours also rose. The restaurants kept pandemic-era staffing buffers on several slow weekday shifts and paid more overtime during weekend coverage gaps.
Channel: Third-party delivery grew quickly, but platform commissions, promotions, and packaging reduced contribution compared with dine-in sales.
Sales Growth Can Hide Margin and Working-Capital Pressure
Illustrative indices only. Prior year = 100 except the cost-ratio index, which reflects the relative change in the percentage. These are not restaurant-industry benchmarks.
The better advisory conclusion
“The group does not have one generic cost problem. Price increases masked lower traffic, food inflation was compounded by unfavorable usage variance, inventory grew faster than sales, labor hours were not flexing with demand, and delivery mix shifted toward a lower-contribution channel. Cash weakened because the restaurants paid for more inventory and labor before those costs produced equivalent contribution.”
The next six management actions
- Update recipe costs and isolate actual-versus-theoretical variance by location.
- Reduce excess inventory and identify slow-moving items.
- Rebuild labor schedules by daypart using transactions and sales per labor hour.
- Analyze third-party delivery contribution after commissions, promotions, and packaging.
- Separate menu-price effect from traffic and mix each month.
- Base owner distributions on the 13-week cash forecast rather than the bank balance.
This is what restaurant accounting looks like when it moves from expense reporting to operational judgment.
A 90-Day Restaurant Accounting Implementation Plan for CPA Firms
Days 1–30: Build the restaurant financial architecture
- Choose the target restaurant client profile
- Map sales channels and systems
- Define sales / discount / tax / tip / service-charge treatment
- Create POS-to-bank reconciliation
- Create COGS and inventory roll-forward
- Create actual-versus-theoretical food-cost analysis
- Create labor schedule-versus-actual analysis
- Define prime cost
- Create unit-level P&L template
- Create 13-week cash forecast
- Define tax / payroll / legal escalation rules
Deliverable: One standardized restaurant accounting playbook.
Days 31–60: Train through cases
- POS settlement mismatch
- Food-cost spike
- Inventory-count error
- Waste / portion variance
- Labor scheduling problem
- Tip / service-charge classification
- Delivery-channel compression
- Gift-card cash / liability issue
- Multi-unit profitability difference
Deliverable: Scored schedules, diagnoses, and simulated owner conversations.
Days 61–90: Pilot with live restaurant clients
- Select clients with reliable POS and inventory data
- Build daily / weekly settlement reconciliation
- Analyze food and labor
- Build unit and channel economics
- Prepare cash forecast
- Lead part of the monthly economics review
- Capture recurring manager corrections
- Measure CPA-firm delivery hours
Deliverable: Evidence that restaurant expertise can transfer beyond one niche partner.
Read Scenario-Based Training for Accountants for developing judgment before live client decisions depend on it.
The Complete 30-Day Restaurant Accounting Curriculum
Days 1–5: Restaurant business model
- Concept types
- Sales channels
- POS terminology
- Dayparts
- Menu categories
- Unit economics
- Franchise / independent differences
Evidence: Restaurant concept and systems map.
Days 6–10: Sales, settlements, and cash controls
- Gross vs net sales
- Discounts / comps
- Sales tax
- Tips / service charges
- Merchant settlements
- Delivery statements
- Gift cards
Evidence: Daily sales and settlement reconciliation.
Days 11–15: Food, beverage, and inventory
- COGS
- Inventory counts
- Purchasing
- Transfers
- Recipe cost
- Actual vs theoretical
- Waste
Evidence: Food-cost bridge and variance analysis.
Days 16–20: Labor and prime cost
- Scheduling
- Actual hours
- Overtime
- Payroll burden
- Tipped payroll
- Sales per labor hour
- Prime cost
Evidence: Labor and prime-cost diagnostic.
Days 21–25: Menu, unit, and cash economics
- Menu contribution
- Channel contribution
- Unit P&Ls
- Occupancy
- 13-week cash
- Capex
- Owner distributions
Evidence: Restaurant owner review package.
Days 26–30: Independent capstone
- Receive unfamiliar restaurant case
- Map systems and sales
- Reconcile POS and cash
- Analyze food / inventory
- Analyze labor
- Calculate prime cost
- Analyze channel / menu economics
- Forecast cash
- Present three management actions
- Escalate payroll, sales-tax, legal, and complex tax questions
Evidence: Complete MARGIN capstone and 100-point readiness score.
The 30/60/90-Day Live-Work Progression
Days 31–60: Controlled analytical responsibility
The learner may:
- Prepare POS-to-bank reconciliations
- Update COGS and inventory schedules
- Prepare food-cost variance reports
- Update labor dashboards
- Prepare unit P&Ls
- Update 13-week cash forecasts
Days 61–90: Scoped client-facing responsibility
Expand responsibility when the learner can:
- Explain sales-to-settlement differences
- Diagnose food-cost movement
- Connect labor percentage to hours, rates, and sales
- Explain actual versus theoretical cost
- Separate tip and service-charge accounting questions
- Analyze delivery / menu contribution
- Frame cash decisions
- Recognize state-tax, payroll, and legal boundaries
After day 90: Increase complexity without blurring authority
Complex sales-tax positions, wage / tip-credit law, franchise-agreement interpretation, liquor compliance, employment law, transaction structuring, valuation, and advanced tax matters remain subject to appropriate specialist review.
100-Point Restaurant Accounting Readiness Scorecard
| Capability | Points | Observable Evidence |
|---|---|---|
| Concept and sales-channel fluency | 8 | Explains concept, dayparts, revenue channels, units, POS systems, and major operating differences |
| POS / settlement / GL reconciliation | 14 | Reconciles gross sales, discounts, taxes, tips, service charges, delivery, merchant settlements, and bank deposits |
| Food / beverage and COGS | 12 | Builds inventory roll-forward, food-cost percentage, category costs, and cutoff correctly |
| Inventory / variance judgment | 12 | Explains actual vs theoretical variance, units of measure, transfers, waste, purchasing, and count errors |
| Labor / tips / payroll fluency | 12 | Connects schedule, hours, wage rates, overtime, payroll burden, tips, service charges, and productivity |
| Prime cost and margin interpretation | 10 | Separates price, volume, mix, food, and labor drivers rather than reporting one percentage |
| Menu / channel economics | 8 | Uses item and channel contribution with operational context |
| Unit and multi-location economics | 8 | Identifies unit outliers, controllable cost, ramp periods, and shared-overhead issues |
| Cash-flow / working-capital judgment | 10 | Builds 13-week forecast and connects settlement timing, inventory, vendors, payroll, tax, debt, capex, and distributions |
| Tax / control / communication boundaries | 6 | Recognizes sales-tax, payroll, tip, legal, franchise, and advanced tax issues and escalates appropriately |
Suggested readiness rule: Require at least 85 points overall, no zero category, an accurate POS-to-cash reconciliation, defensible food and labor analysis, a complete cash forecast, and successful transfer to an unfamiliar restaurant case before the learner independently leads a material restaurant advisory discussion.
15 Realistic Restaurant Accounting Training Scenarios
Scenario 1: POS Sales Do Not Match the Bank
Sales look correct, but card deposits are lower. The learner must reconcile charged tips, processing fees, chargebacks, and settlement timing rather than reducing revenue to the deposit.
Scenario 2: Food Purchases Spike
Purchases rose 20% in one month, but ending inventory also rose sharply. The learner must distinguish purchasing from COGS.
Scenario 3: Food Cost Is High but Recipe Cost Is Stable
Actual food cost rises while theoretical cost barely changes. The learner investigates waste, portioning, inventory, transfers, and theft rather than blaming vendor prices automatically.
Scenario 4: Labor Percentage Jumps
Labor dollars are flat but a weather event cuts sales. The learner must separate the denominator effect from scheduling and wage-rate problems.
Scenario 5: Overtime Is Concentrated in One Daypart
Weekend kitchen overtime is rising even though total restaurant hours appear normal. The learner must analyze daypart scheduling and staffing availability.
Scenario 6: Automatic 20% Charge
A restaurant describes a mandatory service charge as a “tip.” The learner must recognize the federal payroll-tax distinction and route wage / state-law questions appropriately.
Scenario 7: Delivery Sales Are Booming
Third-party delivery sales are up 40%, but contribution is weak because of commissions, promotions, packaging, and refunds.
Scenario 8: Gift-Card Cash Looks Like Revenue
Holiday gift-card sales produce a large cash inflow. The learner must separate cash received from the accounting treatment of the future service obligation.
Scenario 9: One Unit Looks Better Than the Rest
Food cost is unusually low at one location. The learner discovers inventory transfers were not recorded consistently.
Scenario 10: The New Unit Is Losing Money
A recently opened location has high payroll and marketing. The learner separates normal ramp costs from ongoing scheduling and margin problems.
Scenario 11: Menu Price Increase “Worked”
Sales increased after an 8% menu-price increase, but transactions declined 7%. The learner decomposes price, traffic, and mix before celebrating growth.
Scenario 12: High-Margin Menu Item Is Slow
An item has strong contribution dollars but slows the kitchen and causes longer ticket times. The learner recognizes that item-level margin is not the only operational constraint.
Scenario 13: Inventory Is “Protected” Against Inflation
The owner buys extra product expecting vendor increases. The learner models cash use, spoilage risk, storage, and inventory turnover.
Scenario 14: Sales Tax From Delivery Platforms
The restaurant is unsure which sales taxes it collects versus amounts remitted by a marketplace. The learner reconciles the reports and escalates jurisdiction-specific tax treatment.
Scenario 15: “Can I Take $100,000 Out?”
The bank balance looks healthy, but payroll, taxes, rent, a large equipment deposit, and vendor payments are due within three weeks. The learner uses the 13-week forecast before discussing distributions.
Each scenario should require the learner to identify the source system, accounting bridge, operating driver, cash effect, management question, and specialist boundary.
What the CPA Firm Should Measure
| Metric | What It Reveals |
|---|---|
| POS / settlement reconciliations completed accurately | Control over restaurant revenue and cash |
| Food-cost variances diagnosed independently | Movement from bookkeeping to operating analysis |
| Inventory exceptions identified | Physical / accounting fluency |
| Labor analyses by daypart / unit | Ability to interpret staffing rather than report payroll only |
| Cash forecasts kept current | Forward-looking advisory capability |
| Restaurant advisory opportunities surfaced | Connection between compliance data and operating decisions |
| Manager rebuild hours | Whether restaurant expertise is transferring |
| Recurring review notes by category | Training gaps that should become scenarios or playbook content |
| Restaurant client realization / contribution to CPA firm | Whether the niche is profitable for the accounting firm |
| Staff-led owner review questions | Communication and advisory readiness |
Read Accounting Firm Realization Rate and Revenue per Professional for CPA Firms for measuring the economics of the CPA firm’s own specialized service delivery.
Common Restaurant Accounting Training Mistakes
Mistake 1: Booking deposits as revenue
Merchant fees, tips, taxes, delivery deductions, refunds, and settlement timing disappear.
Mistake 2: Treating purchases as food cost
Inventory movement is ignored.
Mistake 3: Using food-cost percentage without sales mix
A menu shift is mistaken for operational waste.
Mistake 4: Trusting theoretical food cost without current recipes
Bad standard data creates false precision.
Mistake 5: Treating labor percentage as a standalone target
Sales volume, service quality, wage rates, hours, and dayparts are ignored.
Mistake 6: Cutting labor to improve a percentage
Guest experience, throughput, and future revenue can deteriorate.
Mistake 7: Combining tips and service charges
Payroll and tax treatment can be wrong.
Mistake 8: Measuring delivery on gross sales
Commissions, promotions, packaging, and refunds disappear.
Mistake 9: Treating gift-card sales as ordinary current revenue
Cash timing is confused with revenue recognition.
Mistake 10: Comparing every restaurant to one “prime cost target”
Concept, service model, geography, pricing, alcohol mix, and labor structure are ignored.
Mistake 11: Consolidating multi-unit restaurants too early
Weak locations and transfer problems disappear in the group total.
Mistake 12: Ignoring inventory as working capital
Profitability analysis misses cash trapped on shelves.
Mistake 13: Treating higher sales as proof of stronger demand
Menu-price inflation can mask lower traffic.
Mistake 14: Letting AI summarize restaurant data before sources reconcile
Fast analysis amplifies bad POS, inventory, or payroll data.
Mistake 15: Building the restaurant niche around one partner
The CPA firm markets specialization but cannot deliver it without constant senior intervention.
Frequently Asked Questions About Restaurant Accounting Training
What is restaurant accounting training for accountants?
It is a structured development process that teaches accountants to connect POS sales, food and beverage cost, inventory, labor, tips, delivery channels, menu economics, tax liabilities, unit profitability, and cash flow to restaurant-owner decisions.
Why is restaurant accounting different from ordinary small-business accounting?
Restaurants combine high transaction volume, perishable inventory, labor-intensive operations, tipped payroll, multiple sales channels, narrow margins, rapid cash movement, and often complex POS and delivery settlements.
How do you calculate restaurant food cost?
A common management calculation is beginning food inventory plus food purchases, plus or minus transfers, minus ending food inventory. Divide the resulting food cost by the appropriate food-sales base for a food-cost percentage.
What is restaurant prime cost?
Prime cost generally combines food and beverage cost with defined labor cost. Firms should document exactly which labor and beverage costs are included before comparing periods or benchmarks.
What is actual versus theoretical food cost?
Actual food cost uses inventory and purchase data to estimate what was consumed. Theoretical food cost uses menu-item sales and standard recipe costs to estimate what should have been consumed. The difference can highlight waste, portions, count errors, theft, or stale recipe data.
What is a good food-cost percentage for a restaurant?
There is no universal percentage. The National Restaurant Association reported 2024 medians of 32.0% for fullservice and 32.4% for limited-service food and non-alcohol beverage costs, but explicitly states its data should not be treated as standards or goals for an individual restaurant.
What is a good restaurant labor-cost percentage?
There is no universal target. In the Association’s 2024 respondent data, median labor including benefits was 36.5% of sales for fullservice and 31.7% for limited service. Concept, geography, service model, wage structure, and sales mix matter.
How should accountants analyze restaurant labor?
Pair labor percentage with scheduled versus actual hours, wage rates, overtime, sales per labor hour, transactions or covers, daypart staffing, service levels, and unit differences.
Are restaurant tips the same as service charges?
No. For federal tax purposes, voluntary tips and mandatory service charges are treated differently. Mandatory service charges distributed to employees are generally treated as wages, while voluntary tips follow the federal tip-reporting rules.
What changed for restaurant tips in 2026?
Current federal law provides an individual deduction of up to $25,000 for eligible qualified tips for tax years 2025 through 2028, subject to limitations. This does not eliminate employer tip-reporting obligations or Social Security and Medicare tax treatment.
What is Form 8027?
Form 8027 is the IRS annual information return for qualifying large food or beverage establishments to report food-and-beverage receipts and employee tips and to determine allocated tips where required.
Can restaurant employers receive a tax credit for payroll taxes on tips?
Potentially. IRS guidance describes a credit for the employer share of Social Security and Medicare taxes paid on certain employee tips in qualifying food and beverage establishments, generally claimed on Form 8846.
How should third-party delivery be accounted for?
Reconcile gross order sales, discounts, promotions, platform commissions, refunds, taxes, tips, packaging, and the net settlement. Do not assume the net bank deposit equals restaurant revenue.
How should restaurants account for gift cards?
Gift-card sales create cash before the related food or service is delivered. Accounting depends on the reporting framework and breakage policy, so staff should reconcile issuance, redemption, and outstanding liability rather than treating every gift-card sale like a completed restaurant sale.
What restaurant KPIs should accountants track?
Useful metrics include net sales, transactions or covers, average check, food and beverage cost, actual versus theoretical food cost, labor percentage, sales per labor hour, prime cost, item contribution, channel contribution, inventory turns, unit contribution, and cash coverage.
Why can restaurant sales rise while profit falls?
Price increases can raise sales while traffic declines, or food, labor, delivery, occupancy, merchant, and other costs can rise faster than revenue. Sales growth should therefore be decomposed into price, volume, mix, and cost effects.
Why can a profitable restaurant be cash-tight?
Inventory purchases, payroll timing, vendor payments, taxes, debt, equipment, new-unit investment, owner distributions, and settlement timing can consume cash even when the P&L shows profit.
How can a CPA firm build a scalable restaurant advisory niche?
Standardize the POS and inventory data set, KPI definitions, reconciliations, cash forecast, review cadence, staff training, manager review, exclusions, and pricing so multiple accountants can deliver consistent insight without requiring one partner to rebuild the analysis.
Can Your Staff Explain Why Sales Are Up, Where Margin Is Leaking, and What the Restaurant Owner Should Change Next?
SkillAbility helps accounting firms develop technical execution, industry fluency, advisory judgment, client communication, manager capability, and leadership readiness through structured practice, scenarios, feedback, and measurable development pathways.
Book Your Free 10-Minute Structural Alignment Review →
Includes our 45-Day Out-of-Pocket Performance Guarantee.
To turning restaurant accounting into better operating decisions,
Vincent Howard, CPA
Managing Partner, Howard, Howard and Hodges
SkillAbility for Accounting Firms
About the Author
Vincent Howard, CPA has practiced public accounting since 1990. He earned a Bachelor of Science in Accounting and a Master’s in Taxation from the University of Central Florida, founded his accounting firm in 1993, and serves as Managing Partner of Howard, Howard and Hodges. He helped grow the organization from three people to approximately 50 staff across multiple Florida locations and states. He has participated in PASBA since 1997, and the firm was named PASBA Firm of the Year in 2015. Since 2020, he has built and run the SkillAbility accounting workforce development platform, used by more than 1,000 accounting professionals across dozens of PASBA firms.
© 2026 SkillAbility for Accounting Firms. This article provides general educational information and does not replace accounting, tax, payroll, wage-and-hour, tip, sales-tax, franchise, liquor, employment, legal, technology, valuation, or other qualified advice. Restaurant economics and applicable rules vary materially by concept, jurisdiction, entity, sales channel, and operating model.