
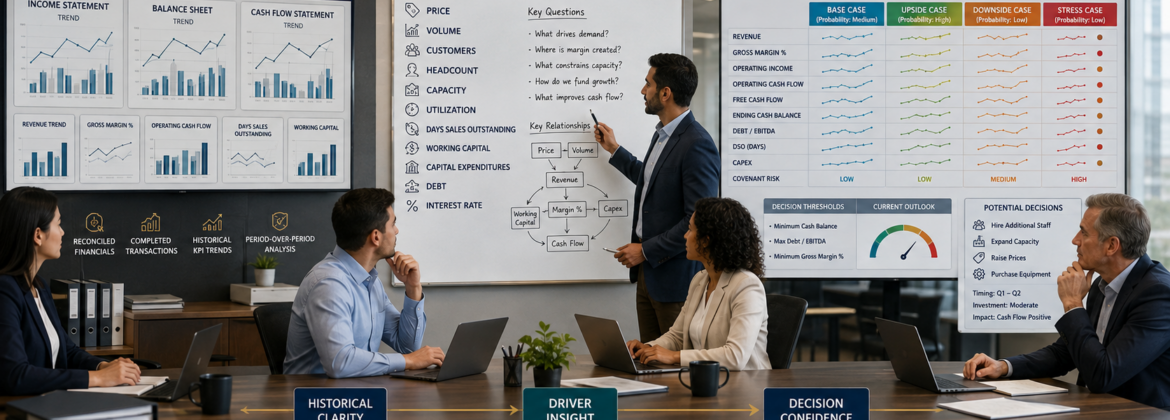
 By Vincent Howard, CPA | Managing Partner, Howard, Howard and Hodges | SkillAbility for Accounting Firms
Last updated: August 11, 2026 | 49-minute read
- What financial modeling training means
- Why modeling capability matters now
- Historical financials vs. decision models
- The DECISION framework
- Define the decision before opening Excel
- Build the historical baseline
- Identify operating drivers
- Build a three-statement model
- Model revenue
- Model margin and operating costs
- Model working capital
- Model capex, depreciation, debt, and interest
- Make cash the model’s reality check
- Choose the right forecasting method
- Scenario, sensitivity, and stress testing
- Model controls and error prevention
- Design decision-ready outputs
- Five CPA advisory model use cases
- AI and automation in financial modeling
- How managers should review models
- Worked decision-model example
- Financial modeling capability dashboard
- 90-day implementation plan
- 30-day training curriculum
- 100-point readiness scorecard
- 15 realistic modeling scenarios
- What the firm should measure
- Common modeling mistakes
- Frequently asked questions
A client asks:
“Can we afford to hire another manager in September?”
The accountant sends a trailing-12-month income statement.
The client asks again:
“Can we afford to hire another manager in September?”
The historical financials are correct.
They simply do not answer the decision.
To answer it, the accountant may need to model:
- Current backlog and demand
- Revenue capacity
- Manager salary and payroll burden
- Ramp time
- Expected productivity
- Gross margin
- Collections timing
- Working capital
- Minimum cash
- Debt covenants
- Alternative start dates
- Downside revenue
Historical accounting tells management what happened. A decision model shows what has to be true for the next decision to work.
Who I Am and Why This Matters
I have practiced public accounting since 1990. I founded my accounting firm in 1993, merged it in 2001 to form Howard, Howard and Hodges, and helped grow the organization from three people to approximately 50 staff across multiple Florida locations and states. Our firm was named PASBA Firm of the Year in 2015.
Accountants have a major advantage when learning financial modeling: they already understand how transactions become financial statements.
The missing skill is often learning how operational assumptions move through those same statements before the transactions occur.
Since 2020, I have built and run the SkillAbility accounting workforce development platform, used by more than 1,000 accounting professionals across dozens of PASBA firms.
The goal is not to turn every accountant into an investment banker or FP&A specialist. It is to develop enough modeling judgment that staff can convert historical accounting knowledge into useful forecasts, scenarios, cash-flow models, and client decisions—then recognize when a model requires specialist expertise.
Read KPI Advisory Training for Accountants for selecting the drivers worth modeling and Cash Flow Advisory Training for Accountants for translating model outputs into liquidity decisions.
What Is Financial Modeling Training for Accountants?
Financial modeling training develops an accountant’s ability to represent how a business is expected to perform under defined assumptions and to use that representation to evaluate decisions, risks, scenarios, and trade-offs.
The Association for Financial Professionals defines a financial model as a representation of expected financial performance that simulates potential outcomes by defining assumptions about operating and financial relationships.
Source: AFP Financial Modeling.
A model should answer a question
Examples:
- Can we afford another hire?
- What happens if price increases 5 percent and volume falls 2 percent?
- When will cash fall below our minimum?
- Can this location support its debt?
- How much working capital will growth consume?
- What happens if the largest customer leaves?
- Should we buy equipment or continue outsourcing?
- What revenue is required to break even on a new service?
A model is not the same as a forecast
A forecast estimates what management currently expects to happen.
A model is the underlying structure that can produce forecasts and alternative outcomes when assumptions change.
A model is not the same as a budget
A budget often represents an approved operating plan.
A decision model may test alternatives that management never intends to approve.
A model is not a guarantee
A model can be mathematically correct and economically wrong if the assumptions are wrong.
Why Financial Modeling Capability Matters Now
Finance is being pushed toward scenario planning and decision support
AICPA & CIMA’s August 2026 controller and finance-manager program explicitly teaches professionals to transform routine reports into scenario analyses that show alternative business futures and support decision-making.
Source: Annual Update for Controllers and Finance Managers: Driving Business Value.
The profession’s future agenda emphasizes higher-value judgment
AICPA & CIMA’s Rise2040 initiative, launched in June 2026 after engagement with more than 6,000 accounting and finance professionals across 25 countries, describes professionals moving beyond compliance toward strategic advice, scenario planning, strategy, and decision enablement.
Source: AICPA & CIMA Rise2040.
But modeling is only as good as the data underneath it
The 2025 AFP FP&A Benchmarking Survey found that data reliability and accessibility were bigger technology barriers than the tools themselves: 61 percent of respondents cited unreliable data as a challenge and 60 percent cited inaccessible data.
The same research found spreadsheets remain dominant: 96 percent reported using them for planning and 93 percent for reporting on a daily or weekly basis.
Source: 2025 AFP FP&A Benchmarking Survey: Technology & Data.
Modeling Technology Is Common. Data Quality Is Still the Constraint.
Source: Association for Financial Professionals, 2025 FP&A Benchmarking Survey. Measures represent different survey questions and should not be added together.
Automation raises the value of model judgment
Journal of Accountancy showed in May 2026 how standardized Excel structures can automate horizontal, vertical, and trend analysis when new financial statements arrive. Automation can reduce repeated formula rebuilding, but accountants still need to decide which relationships matter and how those relationships should behave in the future.
Source: Use Excel to automate financial statement analysis.
Historical Financials vs. Decision Models
| Historical Accounting | Decision Modeling |
|---|---|
| Records completed transactions | Tests future assumptions and decisions |
| Explains what happened | Explores what could happen |
| Uses actual revenue and expenses | Uses drivers, assumptions, scenarios, and constraints |
| Reconciles to source evidence | Must still reconcile to historical source evidence before projection |
| Outputs financial statements | Outputs decisions, scenarios, liquidity, risk, and financial statements |
Historical analysis is the model’s foundation
Before forecasting, accountants should understand:
- Revenue mix
- Gross margin
- Fixed and variable costs
- Working-capital behavior
- Capital expenditures
- Debt service
- Taxes
- Seasonality
- One-time events
The dangerous shortcut is “last year plus 10 percent”
A percentage-growth assumption may be reasonable in some contexts, but it is not automatically a driver model.
If revenue is really driven by locations × customers per location × average revenue per customer, model those drivers when the decision depends on them.
The DECISION Financial Modeling Framework
D-E-C-I-S-I-O-N
D — Define the Decision
State the management question, decision owner, timing, success measure, and constraints before building anything.
E — Establish the Historical Baseline
Reconcile actual financials and identify the historical relationships that will anchor the model.
C — Connect Operating Drivers
Model the operational activities that cause revenue, cost, capacity, working capital, and cash to move.
I — Integrate the Statements
Connect income statement, balance sheet, cash flow, debt, capex, and other schedules consistently.
S — Scenario and Sensitivity Test
Change the assumptions that matter and observe the effect on outputs, liquidity, covenants, and decision thresholds.
I — Inspect Integrity and Controls
Use checks, reconciliations, sign conventions, documentation, version control, and review to make errors visible.
O — Output the Decision
Present the small number of outputs that determine what management should evaluate next.
N — Note Assumptions and Refresh
Document the assumption owner, source, confidence, update cadence, and model changes as new actuals arrive.
Define the Decision Before Opening Excel
Write the decision in one sentence
Examples:
- Should management hire a second service manager in September?
- Should the company open Location B next year?
- Can the business support a $1.5 million equipment purchase without violating its minimum-cash policy?
- How much price increase is required to preserve margin if labor costs rise 8 percent?
Define the decision owner
The model may inform a CEO, owner, board, lender, operating manager, or investment committee. The model builder should know who will actually decide.
Define the decision horizon
A weekly 13-week cash model, a monthly 18-month operating model, and a five-year strategic model should not have the same level of detail.
Define the decision threshold
Examples:
- Minimum cash never below $400,000
- Debt-service coverage above the agreed threshold
- Location reaches break-even within 14 months
- Project contribution margin above 25 percent
Start with the smallest model that can answer the question
More worksheets do not automatically create better analysis.
Build the Historical Baseline
Use reconciled data
The model should start from financial statements that tie to the general ledger and, where relevant, to:
- AR and AP aging
- Inventory
- Payroll
- Debt
- Fixed assets
- CRM
- Project-management systems
- Operational systems
Use enough history to see behavior
Depending on the business, that may mean:
- 24 to 36 months of monthly data
- Multiple seasonal cycles
- Prior recession or stress periods
- Pre- and post-price-change periods
Normalize unusual history before using it as a forecast anchor
Identify:
- One-time litigation
- Temporary shutdowns
- Unusual bonuses
- Acquisitions
- Discontinued operations
- Owner-specific expenses
- Temporary shortages
Build historical ratios and relationships
Examples:
- Gross margin percentage
- Payroll as percentage of revenue
- Days sales outstanding
- Inventory turns
- Capex as percentage of revenue
- Revenue per employee
- Customer acquisition cost
Read Accounting Firm Realization Rate, Revenue per Professional for CPA Firms, and CPA Firm Utilization Rate for examples of turning historical accounting metrics into management signals.
Identify Operating Drivers
Revenue drivers
Possible structures include:
Cost drivers
Examples:
- Labor hours
- Headcount
- Commission percentage
- Material usage
- Shipping volume
- Locations
- Transactions
- Square footage
Working-capital drivers
Capacity drivers
A model should show when growth hits a constraint.
Examples:
- Technician hours
- Manager span
- Production capacity
- Warehouse space
- Provider appointments
- Equipment throughput
Do not confuse correlation with a driver
A line item may historically move with revenue without being economically caused by revenue.
Build a Three-Statement Model When the Decision Requires It
The income statement answers profitability
Model:
- Revenue
- Cost of sales
- Gross margin
- Operating expenses
- Depreciation
- Interest
- Taxes where appropriate
The balance sheet answers capital and working-capital requirements
Model:
- Receivables
- Inventory
- Payables
- Prepaids
- Fixed assets
- Debt
- Other operating balances
The cash-flow statement answers whether the plan survives
Growth can increase profit while reducing cash.
The statements must link
Examples:
- Net income flows into equity and cash flow.
- Capex increases fixed assets and reduces cash.
- Depreciation reduces income but is added back in operating cash flow.
- Debt draws increase cash and debt.
- Principal payments reduce cash and debt.
Use model checks
If the balance sheet does not balance, the model is not done.
Model Revenue at the Right Level
Do not default to one growth percentage
Better revenue models may use:
- Existing customers
- New customers
- Churn
- Price
- Volume
- Utilization
- Capacity
- Locations
- Sales pipeline
Separate price and volume
A 10 percent revenue increase caused by a 10 percent price increase is economically different from a 10 percent volume increase.
Segment when the business decision changes by segment
Model by:
- Service line
- Location
- Customer cohort
- Product
- Channel
Model new initiatives separately
Do not bury a new location inside the existing revenue-growth assumption.
Model Gross Margin and Operating Costs
Separate variable and fixed behavior
Some costs:
- Move directly with units
- Move in steps when capacity expands
- Remain fixed for a range
- Have inflation or contract escalation
Model labor as people when labor is the real driver
A headcount schedule may include:
- Role
- Start date
- Salary
- Payroll burden
- Bonus
- Ramp period
- Productivity
Use step costs
A business may need a new manager only after every eight employees, or another facility only after capacity exceeds 90 percent.
Model Working Capital Explicitly
Growth consumes cash when collections lag revenue
If revenue grows 20 percent and DSO stays constant, accounts receivable generally grows too.
Do not use one working-capital percentage blindly
Separate:
- AR
- Inventory
- AP
- Deferred revenue
- Accruals
Model seasonality
A seasonal business may need its largest cash cushion before its strongest revenue month.
Connect working capital to the decision
A growth plan that is profitable but requires $900,000 of incremental working capital may need financing before launch.
Model Capex, Depreciation, Debt, and Interest
Capital expenditures affect more than one statement
Capex can affect:
- Cash
- Fixed assets
- Depreciation
- Debt
- Interest
- Maintenance needs
- Operating capacity
Separate maintenance and growth capex
Maintenance capex preserves current operations. Growth capex is intended to create additional capacity or revenue.
Use a debt schedule
Include:
- Beginning principal
- New draws
- Scheduled principal payments
- Interest rate
- Interest expense
- Ending balance
- Covenant calculations where relevant
Watch circular references
Interest expense may depend on debt balances, while debt balances may depend on cash deficits created partly by interest. Build circularity controls deliberately rather than letting the workbook hide the relationship.
Make Cash the Model’s Reality Check
Profit is not liquidity
A business can show growing EBITDA while running out of cash because of:
- Receivables
- Inventory
- Capex
- Debt principal
- Taxes
- Owner distributions
- Growth investment
Use minimum-cash logic
Management may define a minimum operating cash level.
The model can then calculate whether:
- Additional financing is required
- The project start date should move
- Growth must slow
- Distributions should change
Model cash monthly when timing matters
An annual model may show positive year-end cash while hiding a severe liquidity deficit in July.
Read Cash Flow Advisory Training for Accountants for building 13-week and longer-range cash decision systems.
Choose the Right Forecasting Method
Driver-based forecasting
Best when management decisions affect the underlying operational drivers.
Examples:
- Price × volume
- Headcount × productivity
- Locations × average sales
- Customers × average revenue
Trend-based forecasting
Useful when historical patterns are informative and the business relationship is relatively stable.
Seasonal forecasting
Journal of Accountancy’s January 2026 guidance describes Excel’s FORECAST.ETS function, which uses exponential triple smoothing and can incorporate trend and seasonality rather than assuming a constant linear pattern.
Source: How CPAs can use exponential smoothing in Excel for better forecasts.
Hybrid forecasting
A model may use:
- Driver-based revenue
- Trend-based overhead
- Seasonal working capital
- Contracted debt payments
Forecast method should follow the decision
The objective is not statistical sophistication for its own sake.
Scenario, Sensitivity, and Stress Testing
Scenario analysis changes multiple assumptions together
Examples:
- Base case
- Upside case
- Downside case
- Delayed-hiring case
- Customer-loss case
Sensitivity analysis changes one or two variables
Examples:
- Price ±5 percent
- Volume ±10 percent
- DSO +10 days
- Labor cost +7 percent
Stress testing asks what breaks the plan
Examples:
- Largest customer leaves
- Collections slow sharply
- Interest rates increase
- Revenue falls 20 percent
- Hiring ramp takes twice as long
Scenario planning is increasingly central to finance leadership
AICPA & CIMA’s current finance-leadership programs emphasize scenario planning as a way to evaluate alternative business outcomes in uncertainty.
Use probability carefully
Do not attach a precise probability to a scenario unless the basis for that probability is defensible.
Build Model Controls and Error Prevention
Separate inputs, calculations, and outputs
Do not hard-code assumptions throughout calculation formulas.
Use consistent signs
Choose a convention for:
- Revenue
- Expenses
- Assets
- Liabilities
- Cash inflows
- Cash outflows
Use checks
Examples:
- Balance sheet balances
- Sources equal uses
- Debt roll-forward ties
- Cash-flow statement reconciles
- Historical model ties to actual statements
Document assumptions
Every material assumption should show:
- Source
- Owner
- Date
- Confidence
- Update frequency
Use version control
A model named “Final_v7_USE_THIS_FINAL2.xlsx” is not a control system.
Review formulas and logic separately
A workbook can contain correct formulas that model the wrong business relationship.
Design Decision-Ready Outputs
Do not make the client hunt through 14 tabs
The executive output should show:
- Decision
- Base-case result
- Alternative results
- Key assumptions
- Cash impact
- Constraint breaches
- Sensitivity
- Recommendation or next decision
Use bridges
Explain movement from:
- Current revenue to forecast revenue
- Current EBITDA to forecast EBITDA
- EBITDA to cash
- Base case to downside case
Show thresholds
Highlight:
- Minimum cash
- Break-even
- Covenant threshold
- Target margin
- Capacity limit
State what must be true
A good output may say:
“The September hire is supportable if backlog remains above 8 weeks, collections stay below 48 DSO, and the new manager reaches 70 percent productivity by month four.”
Five High-Value CPA Advisory Model Use Cases
1. Hiring model
Connect demand, capacity, payroll, ramp time, margin, and cash.
2. Pricing model
Connect price, volume, churn, gross margin, and customer mix.
3. New-location model
Connect buildout, hiring, ramp, sales, working capital, debt, and break-even.
4. Capex / outsourcing model
Compare equipment purchase, financing, maintenance, labor savings, outsourcing cost, and capacity.
5. Transaction / exit model
Support seller readiness, acquisition modeling, debt capacity, and scenario analysis while routing formal valuation and transaction conclusions appropriately.
Read Business Valuation Training for Accountants, Exit Planning Training for Accountants, and M&A Advisory Training for Accountants for those adjacent decision contexts.
AI and Automation in Financial Modeling
AI can accelerate model construction
Potential uses include:
- Drafting model structures
- Suggesting driver relationships
- Writing or explaining formulas
- Classifying historical expenses
- Summarizing scenario differences
- Generating model-review checklists
- Drafting management commentary
AI cannot validate the business model automatically
It may not know:
- Whether the historical data is reliable
- Whether a cost is really variable
- Whether capacity is constrained
- Whether a covenant definition is correct
- Whether management’s forecast assumption is reasonable
- Whether a formula duplicates an adjustment
Finance adoption of AI is moving quickly
Journal of Accountancy reported in May 2026 that 75 percent of senior finance leaders in a cited global KPMG survey said they were actively using AI in finance, up from 30 percent two years earlier.
Source: AI for CPAs: From efficiency tool to decision engine.
Use AI to challenge assumptions—not to hide them
Useful prompts include:
- Which assumptions create the largest output sensitivity?
- Which formulas break if revenue is negative or zero?
- Which historical relationships are inconsistent?
- Which model outputs depend on unsupported hard-coded values?
- What stress scenario would test liquidity most severely?
Keep confidential data inside approved systems
Client financial models can contain payroll, pricing, customers, debt, bank information, forecasts, and transaction plans. Firms should follow approved AI, confidentiality, privacy, and cybersecurity policies.
How Managers Should Review Financial Models
Review the question first
Can the reviewer state the decision the model is designed to answer?
Review historical integrity
Ask:
- Do actual periods tie to the source statements?
- Are unusual periods identified?
- Are historical ratios calculated consistently?
Review the driver logic
Ask:
- Why does revenue move this way?
- Why does payroll move this way?
- Why does working capital move this way?
- What causes capex?
Review the assumptions
For each material assumption:
- What is the source?
- Who owns it?
- How confident are we?
- When does it change?
Review accounting integration
Check that:
- Statements link
- Debt rolls forward
- Capex and depreciation tie
- Cash reconciles
- The balance sheet balances
Review the decision output
The manager should be able to explain the result without walking the client through formulas.
Read Reviewer Calibration for CPA Firms and Feedback Training for Accounting Managers for building consistent review and coaching standards.
Worked Example: Should the Client Open a Second Location?
Illustrative example only: These figures demonstrate modeling logic. They are not industry benchmarks, investment recommendations, or guaranteed outcomes.
A service business is considering a second location.
Historical baseline
- Existing annual revenue: $4.8 million
- Gross margin: 44 percent
- Existing cash: $750,000
- Existing DSO: 42 days
- No significant unused facility capacity
New-location assumptions
- Buildout and equipment: $600,000
- Opening staff payroll: $42,000 per month
- Opening in January
- Revenue ramp: $60,000 in month one, increasing to $180,000 by month twelve
- Gross margin: 41 percent during ramp
- Minimum cash policy: $400,000
Base case
The model shows the new location reaches monthly operating break-even in month seven, but cash falls to $315,000 in month five because buildout, payroll, and receivables absorb cash before the revenue ramp catches up.
Decision insight
The question is no longer:
“Is the location profitable?”
It becomes:
“How should we finance or stage the launch so the company does not violate its minimum-cash requirement?”
Scenario A: Finance half the buildout
Cash stays above the minimum, but interest expense rises.
Scenario B: Delay two hires by three months
Cash improves, but service capacity becomes a risk if the revenue ramp occurs faster than expected.
Scenario C: Revenue ramp 20 percent slower
Break-even moves later and financing need increases.
A Profitable Project Can Still Create a Cash Constraint
Illustrative relative bars only. The figures demonstrate model structure, not a recommended financing strategy.
The accountant’s recommendation
A strong recommendation might be:
“The expansion appears economically viable under the base assumptions, but the current funding plan causes cash to fall below management’s $400,000 minimum. Before approving the project, management should choose a financing or staging approach and test the downside revenue case. The most decision-sensitive assumptions are revenue ramp, hiring timing, and collections.”
This is the difference between producing a forecast and delivering a decision model.
The Financial Modeling Capability Dashboard
Model integrity
- Historical periods tied to source
- Balance-sheet check
- Debt roll-forward check
- Cash-flow reconciliation
- Version-control status
Assumption quality
- Material assumptions documented
- Assumption owner identified
- Source identified
- Confidence rating
- Update date
Decision quality
- Decision stated
- Decision owner identified
- Thresholds defined
- Scenarios built
- Recommendation connected to outputs
Training quality
- Models built independently
- Repeated model-review corrections
- Manager rebuild time
- Scenario quality
- Client presentation readiness
A 90-Day Financial Modeling Implementation Plan
Days 1–30: Build the model standard
- Define approved model architecture
- Define input / calculation / output conventions
- Create historical import templates
- Create three-statement schedules
- Create revenue, headcount, working-capital, capex, and debt modules
- Define checks and error controls
- Create scenario and sensitivity templates
- Define version-control rules
- Create review checklists
Deliverable: A reusable model framework rather than individual spreadsheets built from scratch.
Days 31–60: Train through decision cases
- Hiring
- Pricing
- New location
- Equipment purchase
- Customer loss
- Debt capacity
- Cash constraint
Deliverable: Scored models with manager feedback.
Days 61–90: Pilot with live advisory work
- Select clients with reliable data
- Define one decision per model
- Build historical baseline
- Build scenarios
- Conduct manager review
- Present decision outputs
- Compare forecast with actuals
- Update assumptions
Deliverable: Evidence that the model helps management make a real decision.
Read Accounting Advisory Proposal Template for scoping financial-modeling work so decision models do not become unlimited ad hoc analysis.
The Complete 30-Day Financial Modeling Training Curriculum
Days 1–5: Historical model foundation
- Financial-statement architecture
- Historical data cleanup
- Trend analysis
- Common-size analysis
- Seasonality
- Model conventions
Evidence: Reconciled historical model.
Days 6–10: Driver schedules
- Revenue
- Headcount
- Margin
- Working capital
- Capex
- Debt
Evidence: Driver-based operating model.
Days 11–15: Three-statement integration
- Income statement
- Balance sheet
- Cash flow
- Debt roll-forward
- Fixed assets
- Model checks
Evidence: Fully integrated forecast that balances.
Days 16–20: Scenarios and sensitivities
- Base case
- Upside / downside
- Stress testing
- Sensitivity tables
- Break-even
- Minimum-cash analysis
Evidence: Scenario package with decision thresholds.
Days 21–25: Client decision modeling
- Hiring
- Pricing
- Expansion
- Capex
- Financing
- Customer concentration
Evidence: Decision memo and client presentation.
Days 26–30: Independent capstone
- Receive an unfamiliar business
- Define the decision
- Build historical baseline
- Choose drivers
- Integrate statements
- Build scenarios
- Test model controls
- Present recommendation
Evidence: Complete DECISION model and 100-point scorecard.
Use Scenario-Based Training for Accountants to develop modeling judgment before client decisions depend on it.
100-Point Financial Modeling Readiness Scorecard
| Capability | Points | Observable Evidence |
|---|---|---|
| Decision definition | 10 | States the decision, owner, time horizon, success measure, and constraints before building the model |
| Historical data integrity | 12 | Reconciles model history to reliable financial and operational sources |
| Driver identification | 14 | Connects revenue, cost, capacity, and working capital to real operating drivers |
| Three-statement integration | 14 | Links income statement, balance sheet, cash flow, capex, and debt consistently |
| Assumptions | 10 | Documents source, owner, date, confidence, and update cadence for material assumptions |
| Scenarios and sensitivities | 12 | Tests the assumptions most likely to change the decision |
| Controls and reviewability | 10 | Uses checks, consistent signs, clear structure, documentation, and version control |
| Cash / constraint analysis | 8 | Identifies liquidity, covenant, capacity, or break-even constraints |
| Decision communication | 6 | Explains outputs, trade-offs, and what must be true without reading formulas to the client |
| Refresh and accountability | 4 | Updates assumptions with actual results and records model changes |
Suggested readiness rule: Require at least 85 points overall, no zero category, a balancing three-statement model where applicable, all material assumptions documented, and manager review before client reliance on high-impact or complex decisions.
15 Realistic Financial Modeling Training Scenarios
Scenario 1: The September hire
A client wants another manager but has not modeled ramp time, collections, or minimum cash.
Scenario 2: The 5 percent price increase
Management assumes revenue rises 5 percent with no volume change. The learner must test churn and mix.
Scenario 3: The second location
The project appears profitable annually but creates a six-month cash deficit.
Scenario 4: The equipment purchase
Management compares only purchase price with outsourcing cost and ignores financing, maintenance, depreciation, capacity, and labor effects.
Scenario 5: The largest customer leaves
A 22 percent customer concentration disappears with 60 days’ notice.
Scenario 6: The DSO shock
Revenue grows exactly as forecast, but DSO increases from 40 to 58 days.
Scenario 7: The spreadsheet that does not balance
The projected income statement looks reasonable, but cash is plugged and the balance sheet is off by $350,000.
Scenario 8: The fixed-cost assumption
A cost has historically been flat, but a new location causes a step increase.
Scenario 9: The forecast from two unusually strong months
The learner must identify seasonality and avoid annualizing a temporary spike.
Scenario 10: The covenant
A debt-capacity model uses an EBITDA definition that differs from the loan agreement.
Scenario 11: The AI-built model
AI creates clean formulas but assumes payroll varies directly with revenue even though headcount moves in steps.
Scenario 12: The hard-coded workbook
One assumption appears in 18 formulas, making scenario changes inconsistent.
Scenario 13: The forecast vs. budget conflict
The approved budget assumes 15 percent growth, but current operating data supports 6 percent.
Scenario 14: The delayed capex
Management wants to defer equipment, but the learner must model the risk of lost capacity and overtime.
Scenario 15: The client asks “what should we do?”
The learner has built a perfect model but cannot translate the outputs into decision conditions and trade-offs.
Each scenario should require the learner to define the question, reconcile history, identify drivers, document assumptions, build alternatives, test controls, and communicate a decision-ready conclusion.
What the Firm Should Measure About Financial Modeling
| Metric | What It Reveals |
|---|---|
| Historical tie-out exceptions | Data integrity before forecasting |
| Models passing all integrity checks | Technical reliability |
| Material assumptions documented | Transparency and reviewability |
| Scenarios tied to actual decisions | Whether analysis is decision-oriented |
| Repeated model-review corrections | Whether modeling capability is transferring |
| Manager rebuild hours | Whether staff independence is increasing |
| Forecast-to-actual variance | Where assumptions or business conditions differ from expectation |
| Assumptions updated on schedule | Model maintenance discipline |
| Client decisions supported | Practical advisory value |
| Modeling realization / contribution | Commercial sustainability |
Read Client Profitability Analysis for Accounting Firms for measuring the economics of modeling-heavy advisory work and Project Management Training for Accountants for controlling model inputs, owners, deadlines, and dependencies.
Common Financial Modeling Mistakes
Mistake 1: Opening Excel before defining the decision
The model becomes a data project instead of a decision system.
Mistake 2: Forecasting from unreconciled history
Bad data becomes a precise-looking future.
Mistake 3: Using revenue growth as the only driver
The model misses price, volume, capacity, customer mix, and operational constraints.
Mistake 4: Ignoring the balance sheet
The forecast shows profit but misses working capital, debt, and cash.
Mistake 5: Plugging cash
The model hides the result it is supposed to reveal.
Mistake 6: Hard-coding assumptions inside formulas
Scenario changes become inconsistent and difficult to audit.
Mistake 7: Building only one case
Management mistakes one forecast for certainty.
Mistake 8: Treating a sensitivity as a scenario
One variable changes while related operating assumptions remain unrealistic.
Mistake 9: Ignoring capacity step costs
The model scales revenue smoothly while the real business needs another manager, machine, or facility.
Mistake 10: Using excessive detail
The model becomes harder to update without materially improving the decision.
Mistake 11: Using insufficient detail
A single growth percentage cannot explain the operating decision.
Mistake 12: Failing to document assumption sources
Review meetings become debates about where the number came from.
Mistake 13: Letting AI write logic nobody understands
Automation reduces visibility into errors rather than reducing errors.
Mistake 14: Presenting formulas instead of decisions
The client receives analysis but no usable conclusion.
Mistake 15: Never refreshing the model
The forecast remains anchored to assumptions that are already known to be wrong.
Frequently Asked Questions About Financial Modeling Training for Accountants
What is financial modeling training for accountants?
It teaches accountants to turn historical financial and operational data into structured forward-looking models that quantify how assumptions and business decisions may affect profit, cash, working capital, financing, and other outcomes.
What is the difference between financial modeling and forecasting?
A financial model is the structure of relationships and assumptions. A forecast is one expected outcome produced by that model.
What is the difference between a budget and a financial model?
A budget usually represents an approved plan. A financial model can test many possible plans, including scenarios management does not intend to adopt.
Should accountants learn three-statement modeling?
Yes when the decisions they support affect profit, working capital, financing, capex, or cash. Not every simple decision requires a full three-statement model.
What are the three statements in a financial model?
The projected income statement, balance sheet, and cash-flow statement. They should be integrated so operating and financing assumptions flow consistently across all three.
What is driver-based financial modeling?
Driver-based modeling connects financial results to operating causes such as units, price, customers, headcount, utilization, capacity, days sales outstanding, or inventory turns.
How much historical data should a financial model use?
Enough to understand the operating relationships, seasonality, trends, and unusual periods relevant to the decision. For many monthly operating models, two to three years may be useful, but the right period depends on the business.
What is scenario analysis?
Scenario analysis changes a coherent group of assumptions together to represent different possible operating futures, such as base, upside, downside, or customer-loss cases.
What is sensitivity analysis?
Sensitivity analysis changes one or a small number of assumptions to show how strongly the output responds to those variables.
What is stress testing?
Stress testing models severe but plausible adverse conditions to identify what would break the plan, such as a large customer loss, collection slowdown, demand shock, or financing constraint.
Should cash be modeled monthly?
When liquidity timing matters, yes. An annual model can hide a midyear cash deficit even when year-end cash is positive.
How should financial-model assumptions be documented?
Material assumptions should include the source, owner, date, confidence level, rationale, and expected update cadence.
Can AI build a financial model?
AI can help draft structures, formulas, classifications, summaries, and review questions. Accountants still need to validate data, business relationships, assumptions, confidentiality, accounting integration, and the decision logic.
What makes a financial model reliable?
Reliable source data, clear purpose, understandable drivers, documented assumptions, consistent structure, integrated statements, model checks, scenario testing, review, and version control.
What financial models are most useful for CPA advisory clients?
Common high-value models include hiring, pricing, cash-flow, new-location, capex, debt-capacity, profitability, acquisition, and exit-planning models.
How should CPA firms train junior accountants in modeling?
Start with historical statement analysis, then driver schedules, three-statement integration, scenarios and sensitivities, model controls, and finally decision-focused client cases with manager review.
Can a financial model be correct and still be wrong?
Yes. Formulas may calculate perfectly while assumptions, business relationships, source data, or decision logic are flawed.
How often should a model be updated?
Update frequency should match the decision. A 13-week cash model may update weekly, an operating forecast monthly, and a strategic model quarterly or when material assumptions change.
Can Your Staff Turn Reliable Financial Statements Into a Model That Shows Management What Has to Be True Next?
SkillAbility helps accounting firms develop technical execution, advisory judgment, client communication, manager capability, and leadership readiness through structured practice, scenarios, feedback, and measurable development pathways.
Book Your Free 10-Minute Structural Alignment Review →
Includes our 45-Day Out-of-Pocket Performance Guarantee.
To turning accounting history into better client decisions,
Vincent Howard, CPA
Managing Partner, Howard, Howard and Hodges
SkillAbility for Accounting Firms
About the Author
Vincent Howard, CPA has practiced public accounting since 1990. He earned a Bachelor of Science in Accounting and a Master’s in Taxation from the University of Central Florida, founded his accounting firm in 1993, and serves as Managing Partner of Howard, Howard and Hodges. He helped grow the organization from three people to approximately 50 staff across multiple Florida locations and states. He has participated in PASBA since 1997, and the firm was named PASBA Firm of the Year in 2015. Since 2020, he has built and run the SkillAbility accounting workforce development platform, used by more than 1,000 accounting professionals across dozens of PASBA firms.
© 2026 SkillAbility for Accounting Firms. This article provides general educational information and does not replace accounting, audit, tax, valuation, financing, investment, legal, professional-liability, lender, or other qualified advice. Financial models are based on assumptions and can differ materially from actual results. Models should be tailored to the client’s facts, source data, engagement scope, professional obligations, and decision context.